


Which Banks Have Been Shedding Reserves?
Reserve balances held with the Federal Reserve banks peaked during the third quarter of 2014 at $2.8 trillion. Since then, the aggregate supply of reserves has declined by 42%, as seen in the figure below.
This post looks at which banks have shed reserves. In particular, we show how community, regional and large banks have responded to the decline in the supply of reserves. Given the recent discussion of how liquidity regulations may be influencing demand for reserves, we also highlight differences across banks subject to and not subject to liquidity regulations.
Peak Reserve Balances to Present
Using Fed accounting data on all banks with Fed accounts, we looked at how their reserve balances have changed over time.We excluded banks that do not have to file Call Reports from the sample. On average, reserve balances in our sample are within 0.17% of total reserve balances reported on the Federal Reserve’s H.4.1 statistical release. This sample includes both domestic banks and U.S. branches and agencies of foreign bank organizations operating in the U.S. There were nearly 6,400 institutions in late 2014, and this number had declined to about 5,400 by early 2019 due to mergers, acquisitions and failures.
We classified each bank by its total asset size and whether it faces the liquidity coverage ratio or resolution planning. In particular, we defined each institution in our sample by bank type (community, regional and large) and liquidity regulation type (liquidity-regulated institutions and “other”).
With these classifications, we calculated the dollar amount of reserves held by each bank liquidity-regulation type at the peak of reserve balances in the third quarter of 2014 and in early 2019. We then calculated the resulting change over this period.
| As of Sept. 30, 2014 (in Billions) | As of Feb. 13, 2019 (in Billions) | Change (in Billions) | |||||||
|---|---|---|---|---|---|---|---|---|---|
| Liquidity-Regulated Institutions | Other | Total | Liquidity-Regulated Institutions | Other | Total | Liquidity-Regulated Institutions | Other | Total | |
| Community | $10 | $294 | $304 | $10 | $255 | $265 | +$0 | -$39 | -$38 |
| Regional | $283 | $1,302 | $1,584 | $262 | $572 | $834 | -$21 | -$730 | -$750 |
| Large | $836 | $836 | $485 | $485 | -$351 | -$351 | |||
| Total | $1,128 | $1,596 | $2,724 | $757 | $827 | $1,584 | -$371 | -$769 | -$1,140 |
| SOURCE: Federal Reserve Accounting System data. | |||||||||
| NOTES: Banks are denoted community banks if total assets reported on Sept. 30, 2014, were less than $10 billion, regional if total assets were between $10 billion and $250 billion, and large otherwise. Banks are denoted as liquidity-regulated institutions if their bank holding company was subject to the liquidity coverage ratio or resolution planning regulation as of the end of 2018. Numbers may not add due to rounding. | |||||||||
Overall, reserves declined from $2.724 trillion in September 2014 to $1.584 trillion in February 2019, a decline of $1.140 trillion. In aggregate, all bank types reduced their reserve holdings over the observation period. Similarly, looking across liquidity-regulated and nonliquidity-regulated banks, both types reduced their reserve holdings.
That said, not all types shed reserves similarly. Regional banks shed more than twice as many reserves than their counterparts, and nonliquidity-regulated banks reduced reserve holdings by about twice as much as regulated banks. Overall, 64% of the decline in total reserves is traced to regional nonliquidity-regulated banks shedding their reserve holdings.
The Evolution of Reserve Holdings
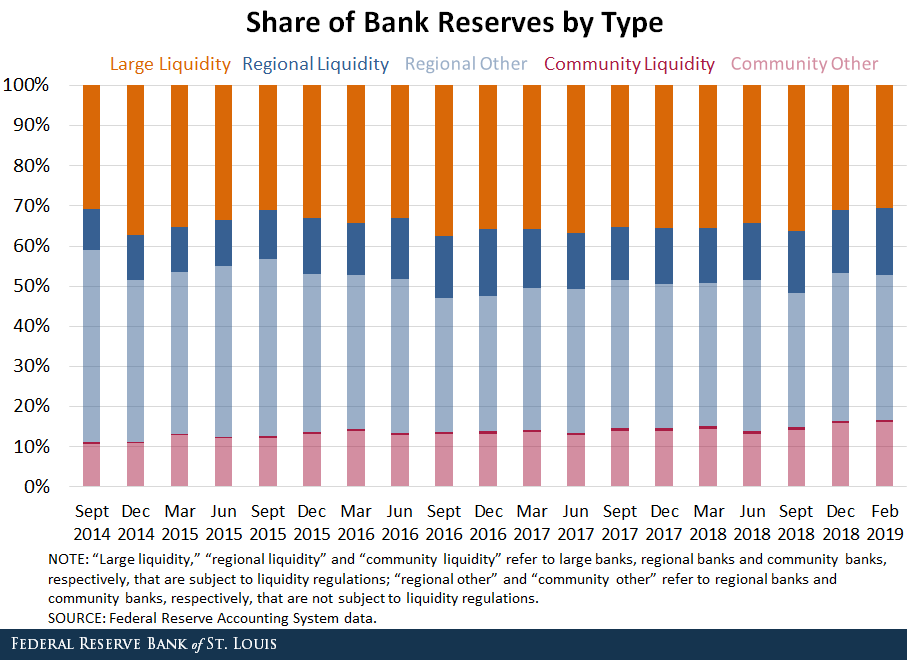
As the aggregate level of reserves in the system has declined, the relative composition of those institutions holding reserves has changed. In the third quarter of 2014, large, regional and community banks held 30.7%, 58.2% and 11.1% of total reserves, respectively. As of February 2019, these shares had shifted a bit to 30.6%, 52.6% and 16.7%, respectively.
Banks subject to liquidity regulations increased their share of total reserves from 41.4% in 2014 to 47.8% in February 2019, while those not subject to the regulations had their share fall from 58.6% in 2014 to 52.2% in early 2019.
This trend is well defined for regional banks. In 2014, regional banks subject to liquidity regulation (dark blue bars) held 10.4% of reserves, while regional banks without liquidity regulations (light blue bars) held 47.8% of total reserves. In February 2019, those same cohorts held 16.5% and 36.1%, respectively.
Policy Implications
The FOMC recently announced that it will conclude redemptions of maturing securities starting in September, slowing the pace of decline in reserves. Policymakers have also stated that they want to implement monetary policy in the longer run with an ample level of reserves. Recent estimates of this level stand around $1 trillion, largely reflecting banks’ demand for reserves in the face of new liquidity regulations imposed since the financial crisis.
Our findings are consistent with the view that liquidity regulations are encouraging regulated banks to hold more reserves than their counterparts. In fact, when looking at reserves as a share of total assets, this ratio is more than double for liquidity-regulated banks than nonregulated banks.
| As of Dec. 31, 2018 | |||
|---|---|---|---|
| Liquidity-Regulated Institutions | Other | Total | |
| Community | 13% | 4% | 4% |
| Regional | 7% | 2% | 4% |
| Large | 6% | 6% | |
| Total | 9% | 4% | 4% |
| SOURCES: Federal Reserve Accounting System and Call Report data. | |||
Conclusion
Banks have responded differently to the reduction in the supply of reserves. Regional banks that are not facing liquidity regulations have been most accommodating to the more than $1 trillion reduction in reserves, though large banks that face regulations have also shed a sizable amount of reserves.
Continuing to track how these banks respond to the shrinking supply of reserves over the remainder of this year may provide insights to policymakers as they consider the ample level of reserves to implement policy for the longer run.
Notes and References
1 We excluded banks that do not have to file Call Reports from the sample. On average, reserve balances in our sample are within 0.17% of total reserve balances reported on the Federal Reserve’s H.4.1 statistical release.
Additional Resources
- On the Economy: Banks’ Demand for Reserves in the Face of Liquidity Regulations
- On the Economy: Why the Fed Should Create a Standing Repo Facility
Citation
Jane E. Ihrig, Mike Milchanowski and Jennifer Detering, ldquoWhich Banks Have Been Shedding Reserves?,rdquo St. Louis Fed On the Economy, April 18, 2019.
This blog offers commentary, analysis and data from our economists and experts. Views expressed are not necessarily those of the St. Louis Fed or Federal Reserve System.
Email Us
All other blog-related questions