


Domestic Debt Before and After the Great Recession

September marked the 10th anniversary of the collapse of the investment bank Lehman Brothers, when the global financial crisis reached a critical stage. Many economists argue that one of the main reasons why the subsequent recession was “great” was due to high levels of leverage and debt, particularly in the financial and household sectors. See, for example, Mian, Atif; Rao, Kamalesh; and Sufi, Amir. “Household Balance Sheets, Consumption, and the Economic Slump,” Quarterly Journal of Economics, 2013, Vol. 128, Issue 4, pp. 1687-726. This blog post tracks the evolution and composition of domestic debt in the U.S. in these last 10 years (and before).
The figure below plots the evolution of total domestic debt outstanding as a percentage of gross domestic product (GDP), including both the financial and nonfinancial sectors, the latter of which includes household and public sector debt.
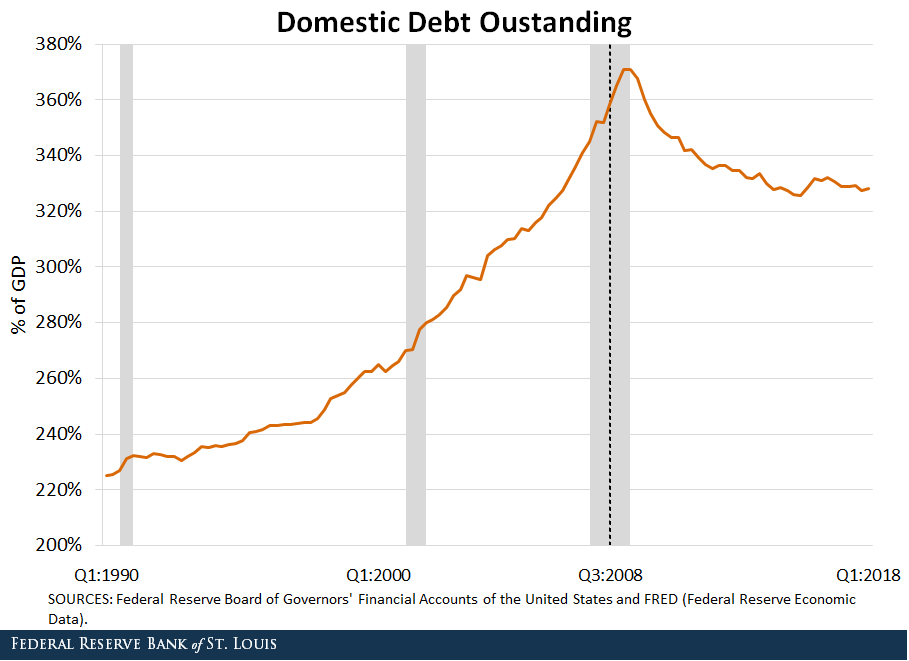
Total debt rose rapidly in the years preceding the Great Recession, peaking at 370 percent of GDP shortly after the fall of Lehman. This ratio has since stabilized around 330 percent of GDP, a value that is still high by pre-2008 standards.
High leverage in the financial sector is partly to blame for the crisis. In the figure below, we decomposed total domestic debt into debt issued by the financial and the nonfinancial sectors.
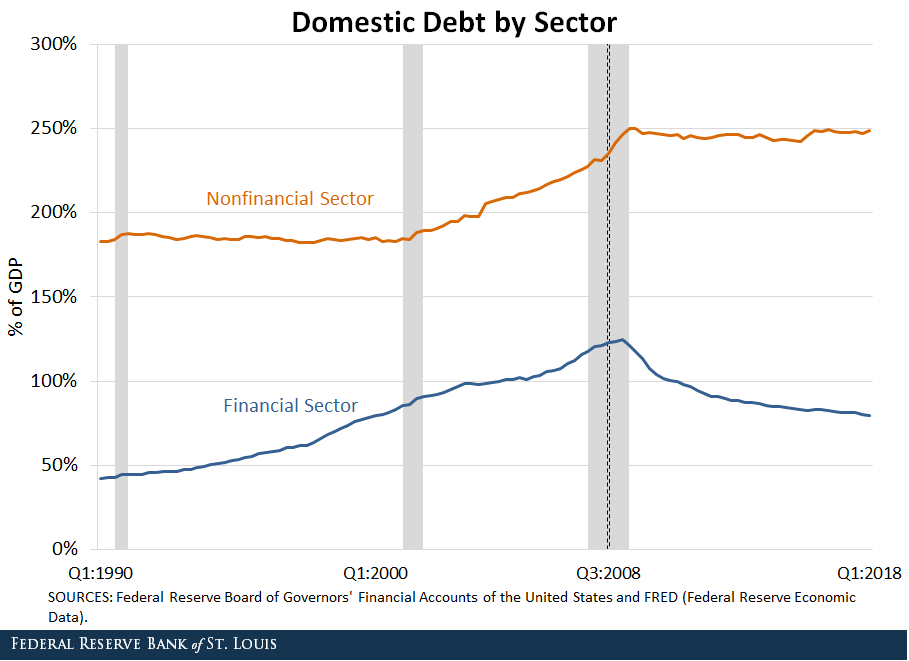
While both sectors increased their debt relative to GDP in the years preceding the crisis, the financial sector seems to have deleveraged after the fall of Lehman.
Since the financial crisis is partly attributed to dysfunctional behavior in the financial system itself, one of the main policy responses was to tighten regulation over financial institutions. Some of the key components of the new regulatory framework imposed limits to leverage or tightened existing ones. Increased regulation has forced financial institutions (especially large ones) to hold more capital and reduce their risk exposures, contributing to lower leverage.
Nonfinancial sector debt, however, has remained constant around 250 percent of GDP. We further broke that series down into debt issued by households, businesses and the government, as seen in the figure below.
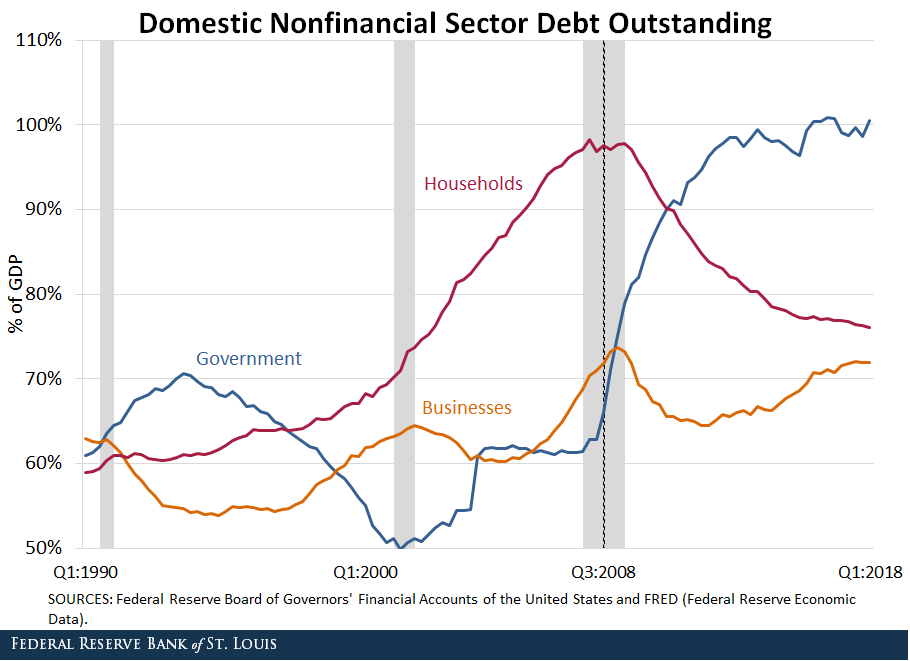
Business debt has increased somewhat, but does not seem to be very far from its historical average of 60 percent of GDP. The two most striking trends are related to household and government debt:
- Household debt has fallen from a peak of almost 100 percent of GDP at the time of the Great Recession to around 76 percent of GDP. (The precrisis average since 1990 was 72 percent.)
- Government debt rose from 60 percent pre-recession to close to 100 percent in the first quarter of this year.
The fall in household debt was primarily driven by the fall in mortgage debt that followed the housing crash. A shift in the composition of this sector mitigated some of the decline: While mortgage debt has fallen, consumer credit has increased slightly as a percentage of GDP, from 17.9 percent in Q3:2008 to 19.3 percent in Q1:2018. The surge in public debt, on the other hand, was partly driven by the large fiscal stimulus packages that were deployed to fight the Great Recession. You can read more about this in Faria-e-Castro, Miguel. “What Are the Fiscal Costs of a (Great) Recession?” Economic Synopses, Aug. 24, 2018.
Conclusion
While total domestic debt has not fallen substantially in the last 10 years, there have been large changes in its composition. In particular, the two sectors whose high indebtedness is considered to have played a large role in triggering the recession—household and financial—have substantially reduced their debt levels.
Notes and References
1 See, for example, Mian, Atif; Rao, Kamalesh; and Sufi, Amir. “Household Balance Sheets, Consumption, and the Economic Slump,” Quarterly Journal of Economics, 2013, Vol. 128, Issue 4, pp. 1687-726.
2 A shift in the composition of this sector mitigated some of the decline: While mortgage debt has fallen, consumer credit has increased slightly as a percentage of GDP, from 17.9 percent in Q3:2008 to 19.3 percent in Q1:2018.
3 You can read more about this in Faria-e-Castro, Miguel. “What Are the Fiscal Costs of a (Great) Recession?” Economic Synopses, Aug. 24, 2018.
Additional Resources
- On the Economy: How Do Americans Rate in Financial Literacy?
- On the Economy: Higher Homeownership Rates Precrisis Predicted Larger Growth Declines
- On the Economy: Why Were Young Families Hit So Hard by the Recession?

Citation
Miguel Faria-e-Castro, ldquoDomestic Debt Before and After the Great Recession,rdquo St. Louis Fed On the Economy, Oct. 16, 2018.
This blog offers commentary, analysis and data from our economists and experts. Views expressed are not necessarily those of the St. Louis Fed or Federal Reserve System.
Email Us
All other blog-related questions