How Do Americans Rate in Financial Literacy?

Financial decisions are some of the most difficult challenges that American families face, for both their complexities and fundamental consequences. There is no single plan that is suitable for all people.
Not only do households differ in their financial goals and situations, but the goals of a particular household can change over time. Indeed, it is unrealistic to expect every American to possess sophisticated financial knowledge.
Still, it is broadly agreed that Americans should have at least basic financial knowledge so they can make fruitful decisions. How proficient are Americans in terms of financial literacy? Do most Americans understand basic concepts of finance? How might financial literacy vary with age, education and income?
Financial Literacy Questions
Three questions in the 2016 Survey of Consumer Finances (SCF) provide insight on these issues.The survey provides cross-sectional data on U.S. households’ demographic characteristics, incomes, balance sheets and pensions every three years. These survey questions ask respondents about diversification in risky investments, compound interest and inflation.
Q1: Do you think that the following statement is true or false: Buying a single company’s stock usually provides a safer return than a stock mutual fund?
- True
- False
Q2: Suppose you had $100 in a savings account and the interest rate was 2 percent per year. After five years, how much do you think you would have in the account if you left the money to grow?
- More than $102
- Exactly $102
- Less than $102
Q3: Imagine that the interest rate on your savings account was 1 percent per year and inflation was 2 percent per year. After one year, would you be able to buy:
- More than today
- Exactly the same as today
- Less than today
Answers: False, More than $102, Less than today
Evaluating Responses
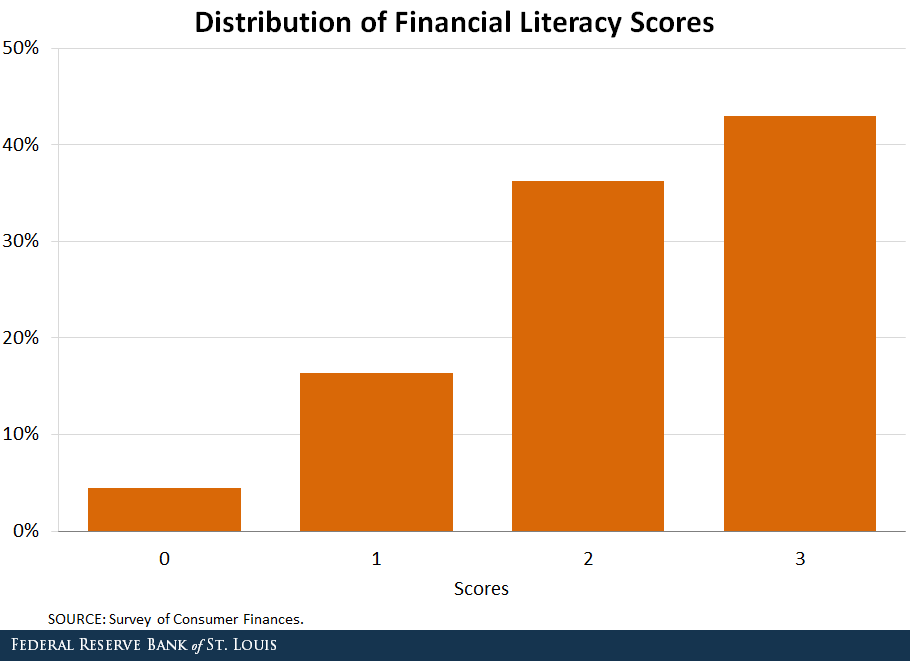
We evaluated a respondent’s financial literacy using the number of questions he/she answered correctly – i.e., their “financial literacy score” – which ranges from 0 to 3. The figure below reports the distribution of scores across the entire population.
The majority of respondents did fairly well:
- 43 percent earned financial literacy scores of 3, meaning they answered all questions correctly.
- 36 percent received scores of 2.
However, another 21 percent of respondents got only one or zero questions correct. In 2016, the average score across all U.S. households was 2.2.

Factors Related to Financial Literacy Scores
What factors can explain the variation in financial literacy scores?
Age
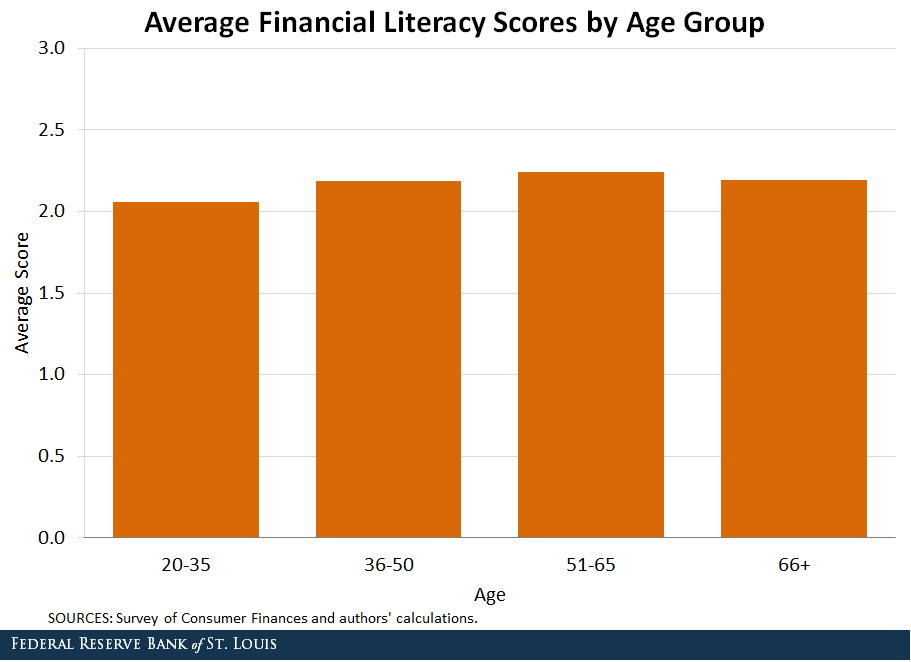
First, we found that scores did not improve significantly with age. This indicates that Americans may not be able to acquire more financial knowledge over the course of their adult lives. The figure below demonstrates this pattern, as average scores increased very slightly from young to middle-age but dropped slightly in the senior group.

Education
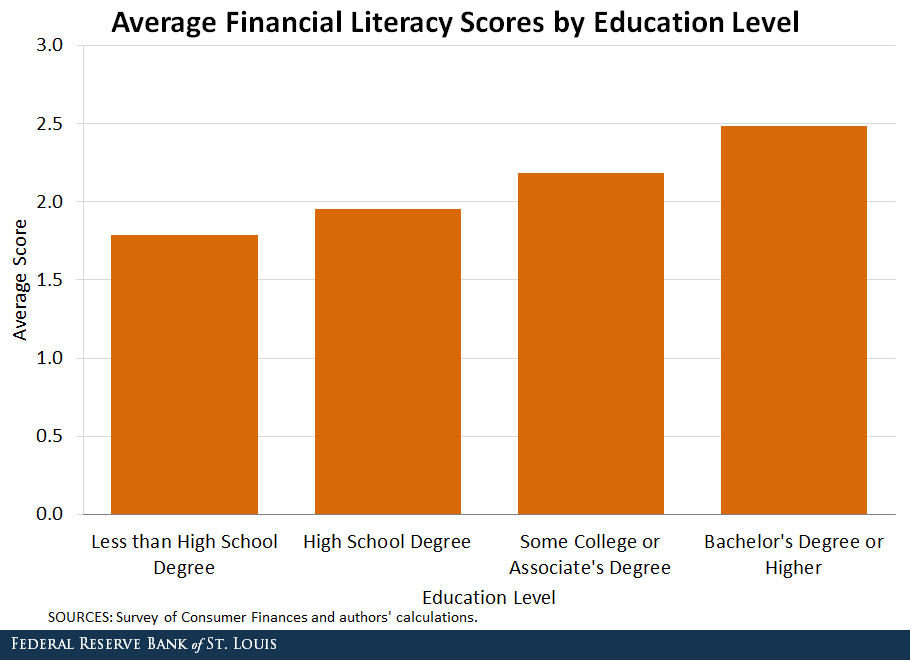
Intuitively, education should be a key factor. The figure below confirms this: Average scores seemed to correlate positively and significantly with education level.
For respondents without high school diplomas, the average score was 1.8, which is well below average. Those with at least bachelor’s degrees earned the highest average score (2.5).

Household Income
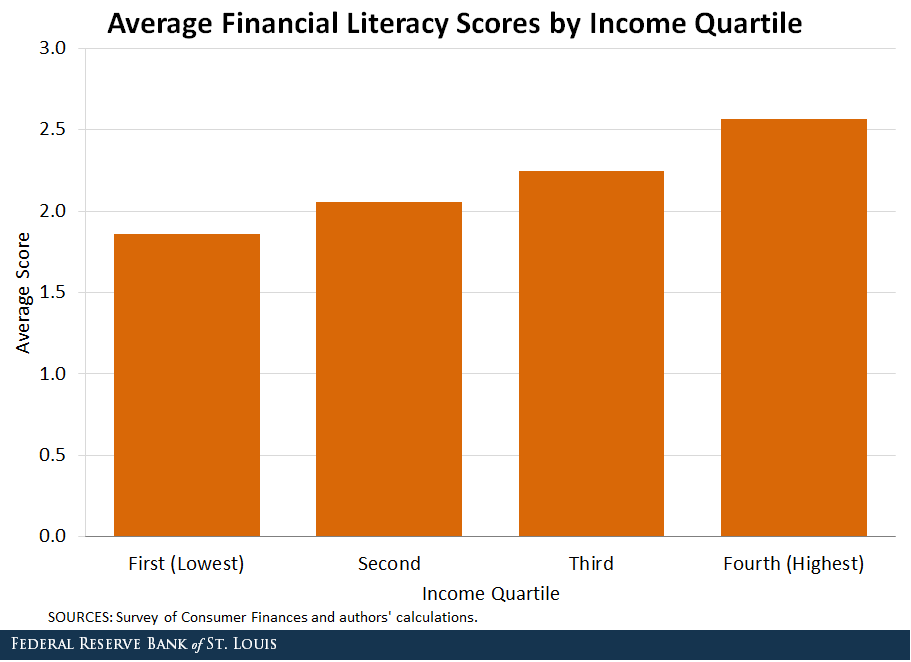
Household income also serves as a strong predictor for financial literacy scores, as seen in the figure below.
The lowest income quartile group only scored 1.9 on average, compared to 2.6 for the highest income quartile. This might not be surprising since income is highly correlated with education.

Conclusion
In short, it is encouraging to find that many American households do well on financial literacy tests. However, survey evidence also indicates that financial literacy is strongly linked to education level and income. This pattern is worrisome because poor households not only earn less but also tend to lack the financial knowledge needed to manage their income properly.
In addition, financial illiteracy does not seem to diminish as individuals get older, indicating that knowledge gaps could persist over lifetimes.
Notes and References
1 The survey provides cross-sectional data on U.S. households’ demographic characteristics, incomes, balance sheets and pensions every three years.
Citation
YiLi Chien and Evan Karson, ldquoHow Do Americans Rate in Financial Literacy?,rdquo St. Louis Fed On the Economy, Sept. 18, 2018.
This blog offers commentary, analysis and data from our economists and experts. Views expressed are not necessarily those of the St. Louis Fed or Federal Reserve System.
Email Us
All other blog-related questions


