How Tight Is the Eighth District Labor Market?

The Beige Book is a Federal Reserve publication about current economic conditions across the 12 Fed districts. It characterizes regional economic conditions and prospects based on a variety of mostly qualitative information, gathered directly from district sources.
The last seven Eighth District Beige Books have indicated that employers are struggling to find workers, specifically those with technical skills. The Eighth District includes all of Arkansas and parts of Illinois, Indiana, Kentucky, Mississippi, Missouri and Tennessee. For this analysis, we used data for entire states, rather than the portions belonging to the Eighth District. Contacts reported that firms are establishing training programs to help address skill gaps. Also, some firms have been increasing wages and offering more attractive benefits to bring in workers, while other firms have lowered hiring standards.
All of this anecdotal evidence indicates a tight labor market. In this post, we look at a couple of labor market measures to evaluate how tight the labor market is in the Eighth District.
Unemployment Rate
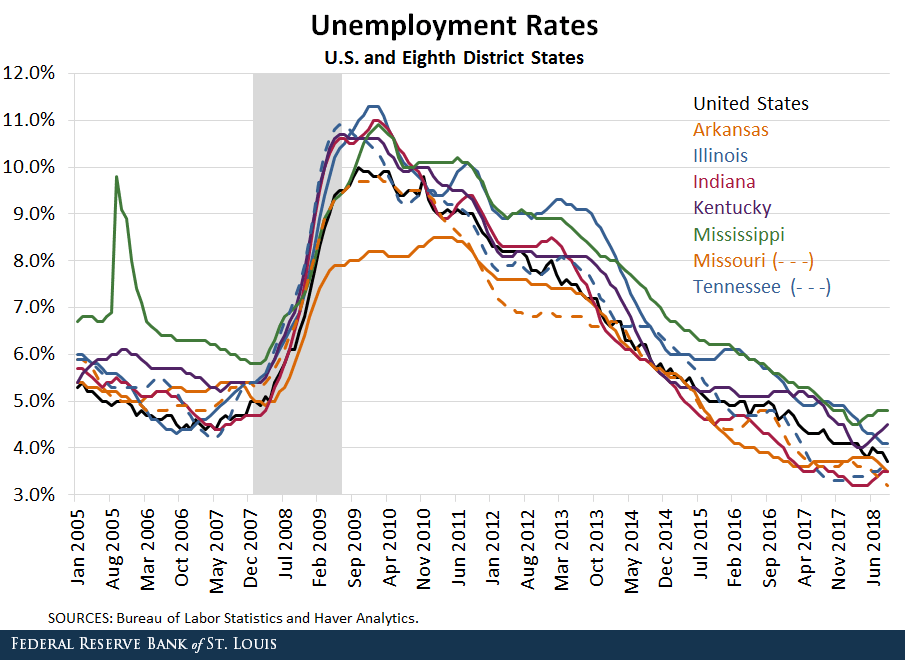
Unemployment is one of the most important statistics of the labor market. It measures the stock of available workers who are searching for work, and thus it indicates the level of unused labor in the economy. In October, the U.S. unemployment rate was 3.7 percent, the lowest level since 1969.
The rate was also below the U.S. Congressional Budget Office’s estimate of the natural rate of unemployment (approximately 4.5 percent). The natural rate of unemployment is the rate of unemployment that arises due to frictional or structural reasons and persists in an expanding economy. For example, frictional unemployment arises when workers search for a job, due to the time it takes to find a job. This type of unemployment will continue to exist even during good economic times.
As we see the unemployment rate falling below the natural unemployment rate, we would expect to see a tight labor market as there are so few workers available.

We see in the figure above that the September unemployment rates for Illinois, Kentucky and Mississippi were above the national rate, while Arkansas, Indiana, Missouri and Tennessee had rates below the national rate. Unemployment rates at the state level for October had not been released at the time of publishing. However, the unemployment rate was near the lowest level for all states in the Eighth District in over a decade, indicating that labor supply is near record lows.
Labor Market Tightness
Unemployment gives us a measure of labor supply in the economy. However, this is only one side of the labor market. We can get a more complete picture of the labor market by using job vacancies as a measure of labor demand from firms.
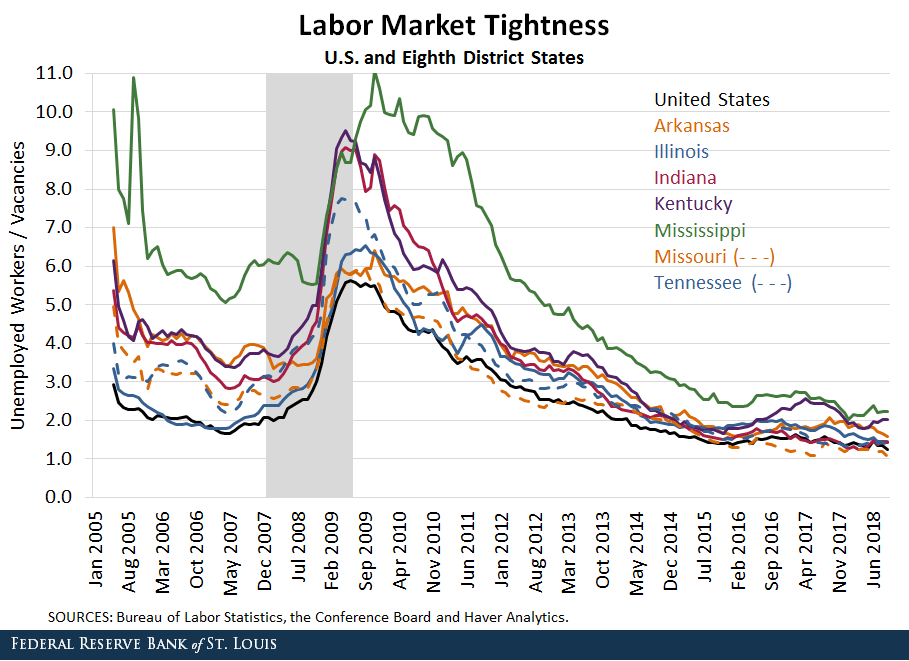
Our vacancy measure comes from the Conference Board, which tracks online help-wanted ads. The number of unemployed workers per vacancy (U/V) provides a way to summarize labor market tightness:
- When this ratio is high, many workers are competing for just a few job opportunities. (This often occurs during recessions.)
- A low ratio indicates a tight labor market. (This often occurs during economic expansions.) Tasci, Murat; and Treanor, Caitlin. “Labor Market Tightness across the United States since the Great Recession.” Federal Reserve Bank of Cleveland Economic Commentary, Jan. 16, 2018.

Labor market tightness in the U.S. and states in the Eighth District has been at historic lows. The U/V ratio for the U.S. was 1.26 in September. All states in the District except Missouri had a U/V ratio slightly above the U.S.’s level, but their ratios were still near all-time lows. Therefore, labor markets in the Eighth District are not as tight as the nation, but there has not been a more difficult time to find workers in over 10 years in the District based on these data.
Given these data, it comes as no surprise that so many firms report struggling to find workers in the Eighth District.
Notes and References
1 The Eighth District includes all of Arkansas and parts of Illinois, Indiana, Kentucky, Mississippi, Missouri and Tennessee. For this analysis, we used data for entire states, rather than the portions belonging to the Eighth District.
2 Unemployment rates at the state level for October had not been released at the time of publishing.
3 Tasci, Murat; and Treanor, Caitlin. “Labor Market Tightness across the United States since the Great Recession.” Federal Reserve Bank of Cleveland Economic Commentary, Jan. 16, 2018.
Additional Resources
- On the Economy: Most Jobs Face Automation in Next 20 Years
- On the Economy: Job and Wage Growth Since the Great Recession
- On the Economy: Southern States Lacking Middle-Skilled Workers Risk Falling Behind
Citation
Paulina Restrepo-Echavarría and Brian Reinbold, ldquoHow Tight Is the Eighth District Labor Market?,rdquo St. Louis Fed On the Economy, Nov. 12, 2018.
This blog offers commentary, analysis and data from our economists and experts. Views expressed are not necessarily those of the St. Louis Fed or Federal Reserve System.
Email Us
All other blog-related questions

