


The Weakening of the US Dollar
During 2017, the value of the U.S. dollar fell relative to other main currencies. This weakening of the U.S. dollar has been the subject of recent debate. For example, see Wayne, Alex; and Hunter, Kathleen. “Mnuchin Defends Weaker Dollar Comments as ‘Clear,’ ‘Consistent.’” Bloomberg, Jan. 25, 2018. The debate has highlighted the positives and negatives of a weaker dollar:
- On the positive side, a weaker dollar would benefit the competitiveness of American exports and of American products that face foreign competition in the internal market.
- On the other hand, a weaker dollar would translate to higher prices for consumers of foreign-produced goods.
Most interestingly, the weakening of the U.S. dollar accelerated at the beginning of 2018. The following figures show the evolution of the dollar against other currencies from January 2017 to March 2018.Each graph displays the daily values of one U.S. dollar in terms of the respective foreign currency. The blue lines indicate the actual prices for each day, while the orange lines are the smoothed trends for the exchange rates. The trends were computed using the standard Hodrick-Prescott filter with lambda set at 100,000, the usual value for daily observations.
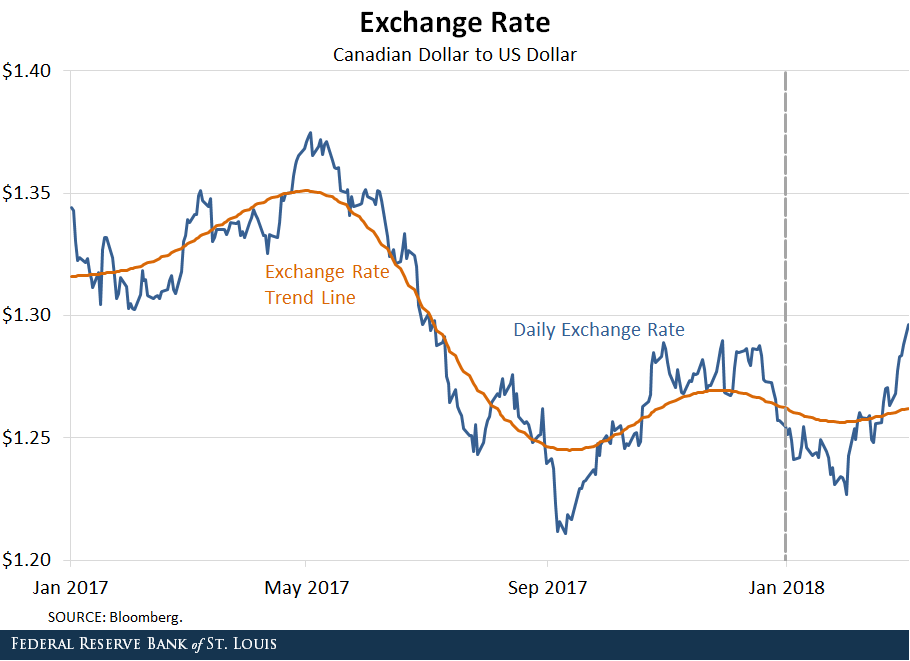
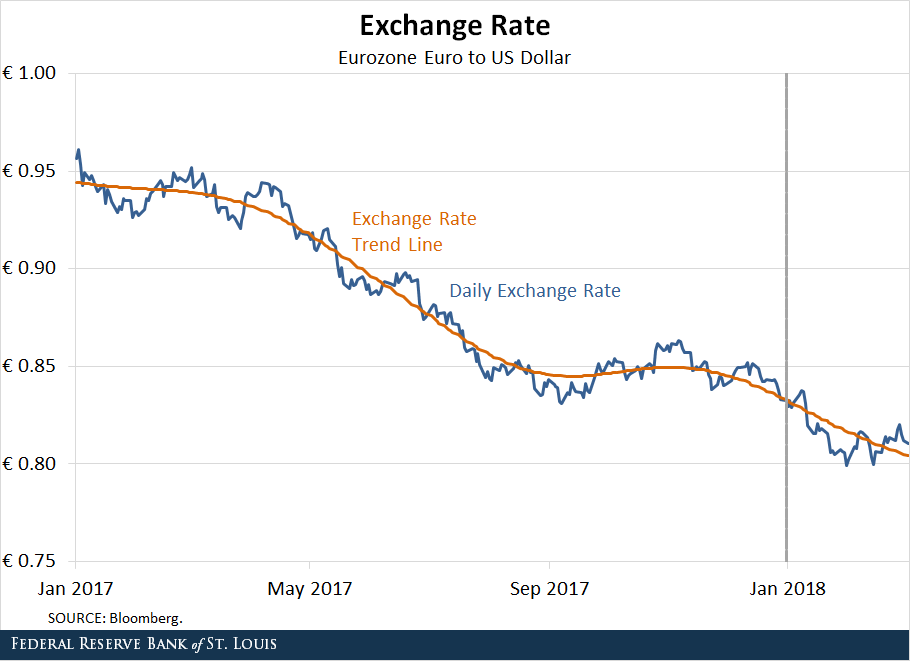
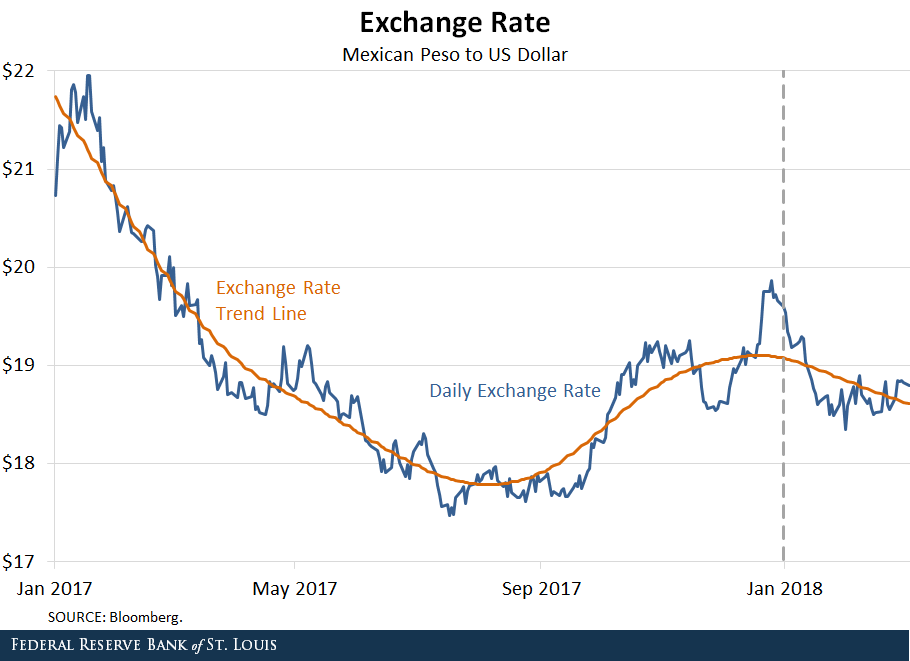
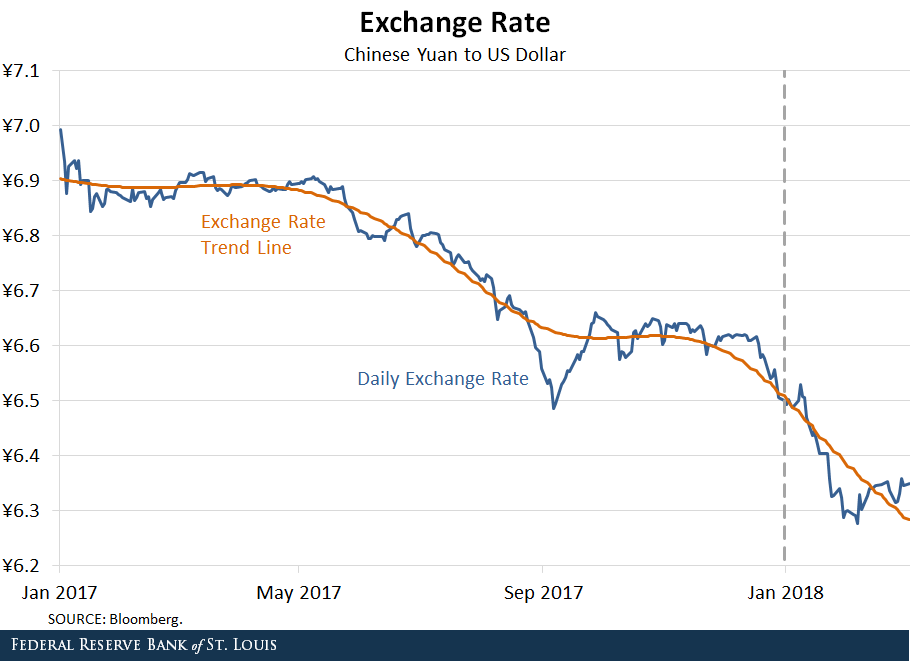
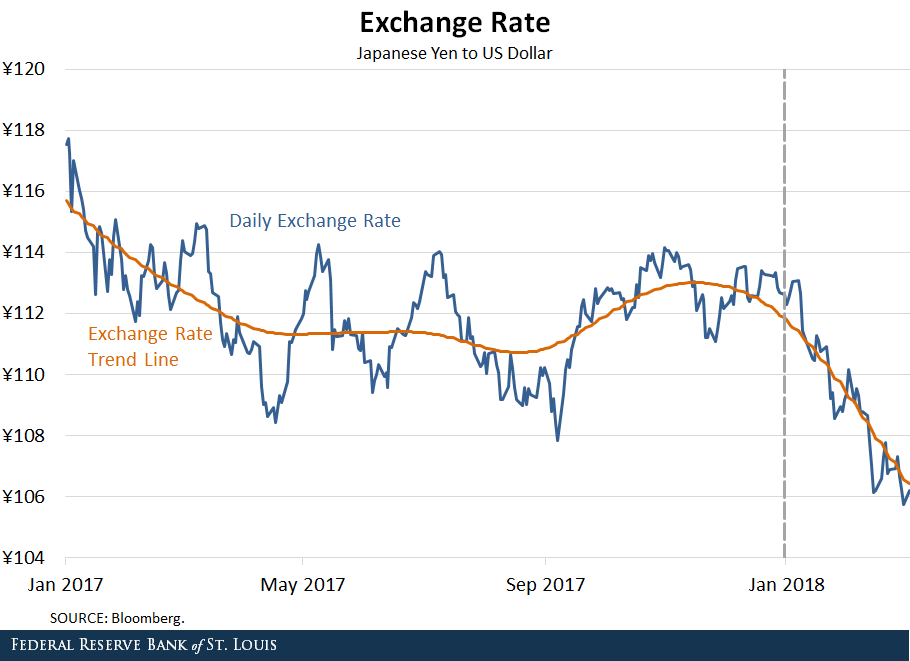
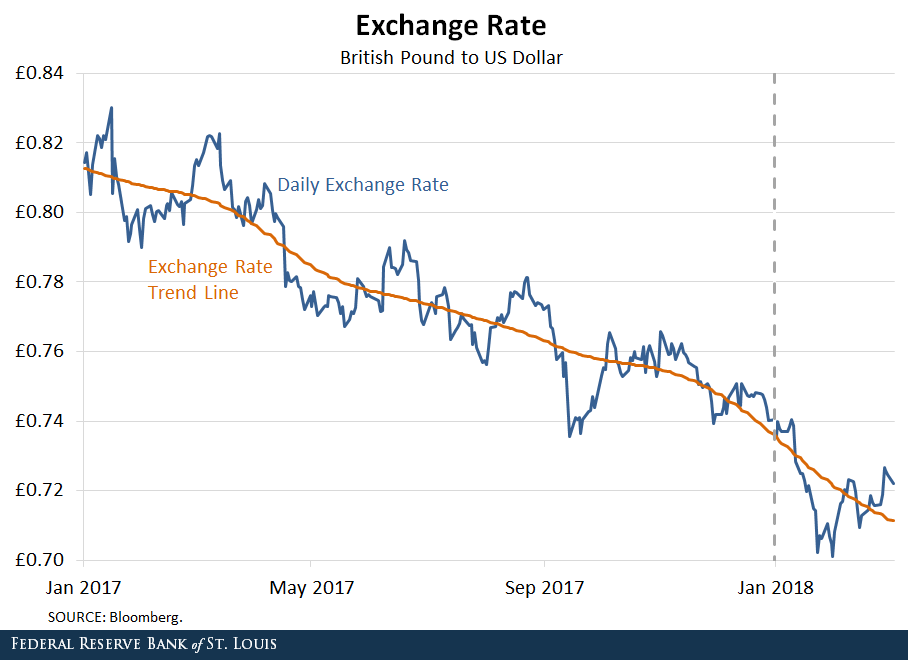
A number of interesting patterns are evident.
U.S. Dollar Depreciation
First of all, the U.S. dollar depreciated during most of 2017 against most of the main currencies. Given the resumption of interest rate hikes during the year—and the prospect of additional hikes in 2018—this behavior is very different from the one observed during the “taper tantrum” of 2013.
The Dollar Depreciating Faster
Second, the depreciation of the U.S. dollar accelerated at the turn of 2018. This acceleration is substantial for some currencies. Such a behavior is remarkable in light of then-recently approved changes in corporate taxes in the U.S., which would suggest higher net returns for U.S. investments.
Subsiding Depreciation
Third, with the exception of Japan, the dive of the U.S. dollar’s value subsided in late February/early March. However, with the exception of Canada, the value of the U.S. dollar was substantially lower in early March 2018 than at the beginning of the year.
The fundamental questions underlying these interesting observations are:
- Whether the weakening of the U.S. dollar is the early manifestation of the medium- or long-term attitudes of investors relative to financial and real investments in the U.S.
- Whether those are also associated with a permanent realignment of the engagement of the U.S. economy with the rest of the world
Notes and References
- For example, see Wayne, Alex; and Hunter, Kathleen. “Mnuchin Defends Weaker Dollar Comments as ‘Clear,’ ‘Consistent.’” Bloomberg, Jan. 25, 2018.
- Each graph displays the daily values of one U.S. dollar in terms of the respective foreign currency. The blue lines indicate the actual prices for each day, while the orange lines are the smoothed trends for the exchange rates. The trends were computed using the standard Hodrick-Prescott filter with lambda set at 100,000, the usual value for daily observations.
Additional Resources
- On the Economy: How Do Rate Hikes Affect the Dollar’s Exchange Rate?
- On the Economy: Using Exchange Rates as Monetary Policy Instruments
- On the Economy: When Does Trade Adjust after Being Liberalized?


Citation
Alexander Monge Naranjo and Hee Sung Kim, ldquoThe Weakening of the US Dollar,rdquo St. Louis Fed On the Economy, April 10, 2018.
This blog offers commentary, analysis and data from our economists and experts. Views expressed are not necessarily those of the St. Louis Fed or Federal Reserve System.
Email Us
All other blog-related questions