


Which States Have the Highest Cost of Living? Lowest?

Intuition tells us that a $40,000 income in Nebraska will go farther in terms of purchasing power than in California. Indeed, cost of living differences across states are important factors to consider when comparing income and budget constraints. A new dataset should help with those comparisons.
Comparing Cost of Living across States
Recently, the Bureau of Economic Analysis released the Regional Price Parities (RPPs), a dataset that allows economists to directly compare the cost of living at the state level. RPPs measure the differences in the price levels of goods and services across states and metropolitan areas for a given year. RPPs are expressed as a percentage of the overall national price level for each year, so RPPs higher than 100 represent state prices higher than the national average and vice versa.
RPPs are important because they help compare the purchasing power behind a person’s income in different areas of the country. For example, an income of $47,520 in Hawaii has the equivalent purchasing power of an income of $34,480 in Mississippi because both of these incomes divided by the state’s RPP equal $40,000.
In 2015 (the most recent year for which data are available), Hawaii’s RPP (118.8) was higher than that of any state or the District of Columbia. The others with the highest RPPs were:
- District of Columbia (117.0)
- New York (115.3)
- California (113.4)
- New Jersey (113.4)
States with the lowest RPPs were:
- Mississippi (86.2)
- Alabama (86.8)
- Arkansas (87.4)
- South Dakota (88.2)
- Kentucky (88.6)
The figure below shows median household income in U.S. states in 2015 on the horizontal axis against the same median household income adjusted by RPPs on the vertical axis. States that fall on the dotted line have price levels equal to the national average. In other words, the nominal and RPP adjusted incomes are the same. States above the line have an RPP below the national average, and states below the line have an RPP above the national average.
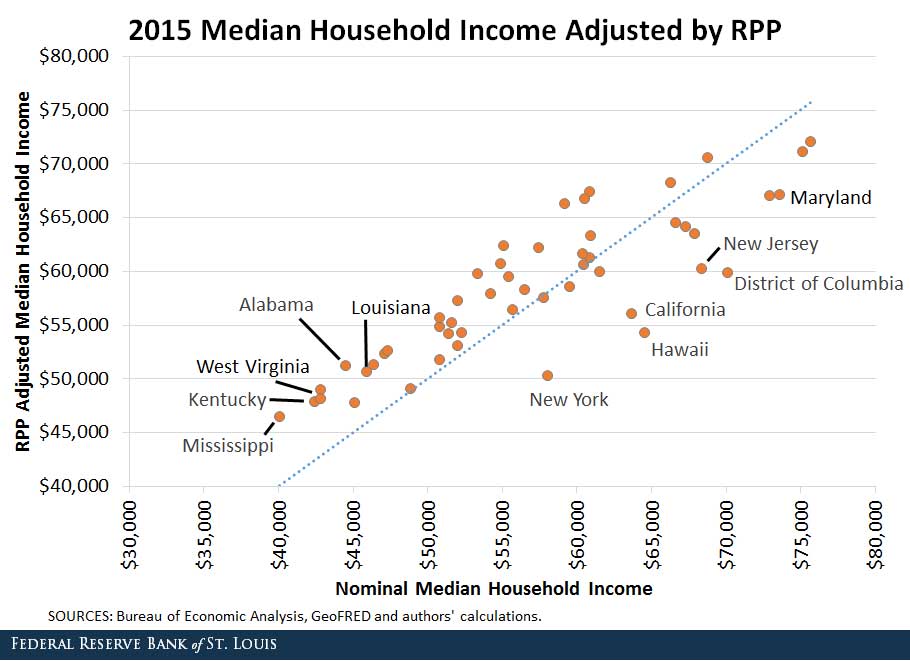
After adjustment, the median household income in the Hawaii falls from $71,223 to $54,304. In Mississippi, however, the median income rises from $40,037 to $46,446.
Since most of the dots to the left are above the blue line and most to the right are below, differences in median income across states are less pronounced once we account for differences in cost of living.
Reasons for Cost of Living Differences
We can look closely at why RPPs differ across geographies. In particular, we can look at price differences for different types of goods and services.
The figures below show the price parities in 2015 for each U.S. state for all items consumed, rents, other services, and goods. The first figure shows that overall price levels are lower in the middle of the country and get higher on the east and west coasts.
The next three figures use the same color categories as the all-items-consumed figure, but offer a visualization of the price parities between their respective categories.
The figure for rents shows a much higher dispersion in price than the other two, which are concentrated on the middle portion of the color scale. This breakdown of price differences by type of good or service shows that most of the variance in cost of living comes from rents (or the imputed user cost of housing services for homeowners, which depends on house prices).
In sum, our analysis shows that cost of living differences should be taken into account when comparing income differences across states, particularly differences in rents and house prices.
Additional Resources
- On the Economy: How Do Incomes in the Largest Cities Compare?
- On the Economy: Rising Inflation Doesn’t Impact Everyone the Same
- On the Economy: Why Do Social Security Disability Rates Differ Across Regions?


Citation
Maximiliano A. Dvorkin and Hannah Shell, ldquoWhich States Have the Highest Cost of Living? Lowest?,rdquo St. Louis Fed On the Economy, July 6, 2017.
This blog offers commentary, analysis and data from our economists and experts. Views expressed are not necessarily those of the St. Louis Fed or Federal Reserve System.
Email Us
All other blog-related questions