How Has Unemployment Rate Recovery Varied across the Country?

The U.S. labor market as a whole seems to have recovered from the effects of the recent recession. The national unemployment rate was 10 percent in October 2009, but stood at 4.7 percent in May, a number which some Federal Open Market Committee (FOMC) participants consider to be close to its long-run value. However, while the labor market as a whole has recovered, certain regions of the U.S. have experienced different patterns of recession and recovery. Some are better off, and some are worse.
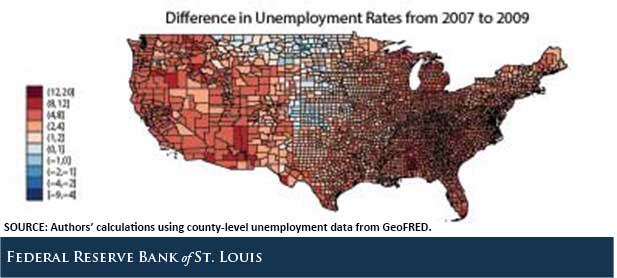
The figure below shows the changes in county-level unemployment rates for the period December 2007 through October 2009. In December 2007, about one in three counties had unemployment rates below 4 percent. As the country progressed into recession, only one in 15 counties maintained unemployment rates below 4 percent.

By October 2009, most counties experienced unemployment rate increases between 2 and 8 percentage points. The areas that had higher unemployment rates before the recession were the same counties that experienced bigger increases during the recession. Unemployment rates rose only slightly in the Northern Midwest and even declined in some counties.
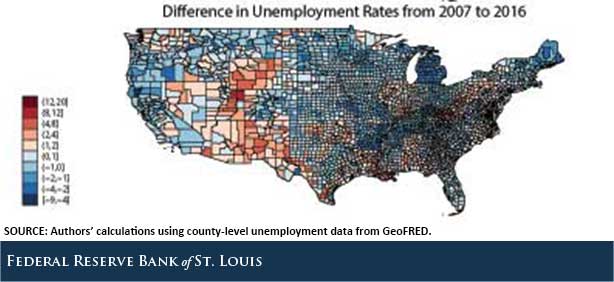
The figure below shows the difference in unemployment rates from December 2007 to April 2016 (the most recent period for which we have data at the county level). Counties where unemployment rates remain elevated from their pre-recession levels are highlighted in red, and areas where the unemployment rate has dropped below the pre-recession level are in blue.

In April, 1,043 counties had unemployment rates below 4 percent—slightly better than in December 2007. Most counties in the Midwest are better off than before the recession, while counties in Arizona, New Mexico, Utah and Nevada continue to experience higher unemployment rates.
The Labor Market and Housing Market
One way to explain the differences in labor market outcomes across the U.S. is to look at the severity of the decline in house prices. Declines in home prices lead to lower consumer net worth, thus decreasing consumer spending through the wealth effect.
Researchers Charles Gascon, Maria Arias and David Rapach constructed metropolitan area economic activity indexes to measure the latent business cycle. They found that areas with lower housing supply elasticity are more vulnerable to recession. Lower housing elasticity leads to larger declines in net worth, which causes declines in consumption spending.
The recent work by Atif Mian and Amir Sufi tied this concept directly to the labor market through the 2007-09 recession, showing that counties with severe declines in housing net worth experienced larger declines in certain areas of employment.1 Looking at the figure, the coastal areas with limited housing supply (such as California and Florida) were some of the most impacted by the recession.
Notes and References
1 Mian and Sufi show that housing net worth mostly affects nontradable employment, or employment in industries that are not tradable outside the local labor areas. For example, restaurants and retail shops are nontradable, while agriculture production is tradable. Mian, Atif; and Sufi, Amir. “What Explains the 2007-2009 Drop in Employment?” Econometrica, November 2014, Vol. 82, No. 6, pp. 2197-223.
Additional Resources
- On the Economy: How Many Unemployed People Are Jobless All Month?
- On the Economy: Many Negative Labor Market Trends Started before the Great Recession
- On the Economy: Nearly Half of All Job Switchers Earn Less in Their New Roles
Citation
Maximiliano A. Dvorkin and Hannah Shell, ldquoHow Has Unemployment Rate Recovery Varied across the Country?,rdquo St. Louis Fed On the Economy, June 28, 2016.
This blog offers commentary, analysis and data from our economists and experts. Views expressed are not necessarily those of the St. Louis Fed or Federal Reserve System.
Email Us
All other blog-related questions


