Fewer Younger, Richer Households Have Negative Home Equity
In a previous post, we showed that, according to the Federal Reserve’s Survey of Consumer Finances, many households remain underwater on their mortgages. Additional research shows that, together with home equity, the ages and incomes of households are important determinants of mortgage defaults. This post shows how changes between 2010 and 2013 in the percent of households with negative equity vary by age and income.
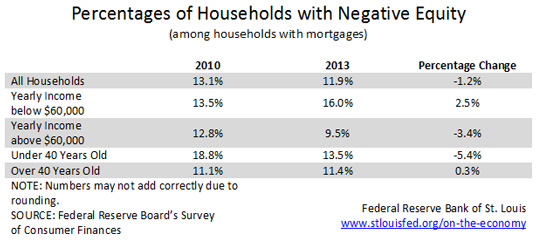
The overall ratio of households with negative equity to the total number of households with mortgages decreased 1.2 percentage points between 2010 and 2013. The table below further decomposes this overall change into two subgroups, according to income and age.

The results are striking. While this ratio increased from 13.5 percent to 16.0 percent for households with yearly incomes below $60,000, it decreased from 12.8 percent to 9.5 percent for households with yearly incomes above $60,000.
The change in the percent of households with negative equity also varies across age groups. From 2010 to 2013, it decreased from 18.8 percent to 13.5 percent, for younger households, while it increased slightly (0.3 percentage points) for older households.
Thus, the aggregate decline in the percent of households with negative equity is driven only by changes for richer and younger households. The opposite trend is actually observed for poorer and older households.
Additional Resources
Citation
Juan M. Sánchez and Lijun Zhu, ldquoFewer Younger, Richer Households Have Negative Home Equity,rdquo St. Louis Fed On the Economy, Nov. 17, 2014.
This blog offers commentary, analysis and data from our economists and experts. Views expressed are not necessarily those of the St. Louis Fed or Federal Reserve System.
Email Us
All other blog-related questions


