


Why Are Workers Staying Out of the U.S. Labor Force?
KEY TAKEAWAYS
- The U.S. labor force participation rate dropped sharply with the COVID-19 pandemic. Many have yet to rejoin the labor market.
- Shifts in retirement and the number of people taking care of family or the home appear to be behind the drop in labor force participation.
- These shifts also appear not to be limited to a certain age range for retirement or a certain gender for family or home care.
Monthly jobs reports show that the level of U.S. employment is gradually recovering. However, the labor force participation rate—the proportion of the working-age population (16 and older) that is employed or looking for a job—remains the lowest since the 1970s. In December 2021, it was 61.9% (down from 63.4% in February 2020) and has remained at similar levels for almost a year and a half.
The recent trend in workers leaving their jobs or the workforce altogether has been dubbed the “Great Resignation.” According to the Job Openings and Labor Turnover Survey of the Bureau of Labor Statistics (BLS), the quit rate—the fraction of employed workers who left their jobs voluntarily—reached an all-time high of 3% in November 2021. Moreover, 6.3 million workers left the labor force in December; this figure was similar, if not slightly higher, throughout 2021.
Trends like these have policymakers wondering where all the workers have gone. In this article, we dive into the data to explain what those who are out of the labor force are doing.
Activities of Those Not in the Labor Force
Our data are aggregated from the monthly individual survey responses of the Current Population Survey (CPS), which is one of the underlying sources of data in the BLS monthly job reports. When respondents are not in the labor force, they are asked to report their primary nonwork activity:The “not in labor force” survey category is split into “retired,” “unable to work” and “other.” The people who report “other” are asked a follow-up question with more options. These encompass the latter six options: “in school,” “taking care of house/family,” “disabled,” “ill,” “other” or “not in universe.”
- Retired
- Unable to work
- In school
- Taking care of house/family
- Disabled
- Ill
- Other
The three figures below show the share (six-month moving average) of the non-labor force population that falls into each of the seven activities. The most common activities are retirement, schooling and housework/family care. The overall trends in these three most common activities are quite different, however. The share of retired individuals has been steadily increasing, a consequence of the overall aging population of the U.S., while the proportion in school has been declining. The proportion taking care of home or family had also been declining but then experienced an uptick during the pandemic and now remains well above where it would have been had it kept declining at the same rate.
Composition of the U.S. Working-Age Population Not in the Labor Force: By Share of Activity
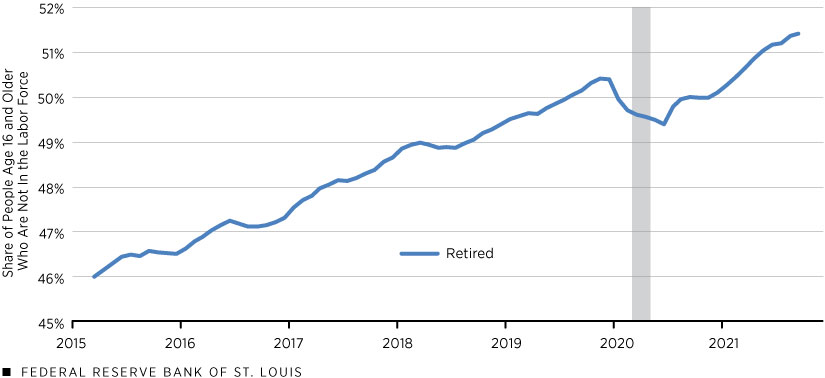
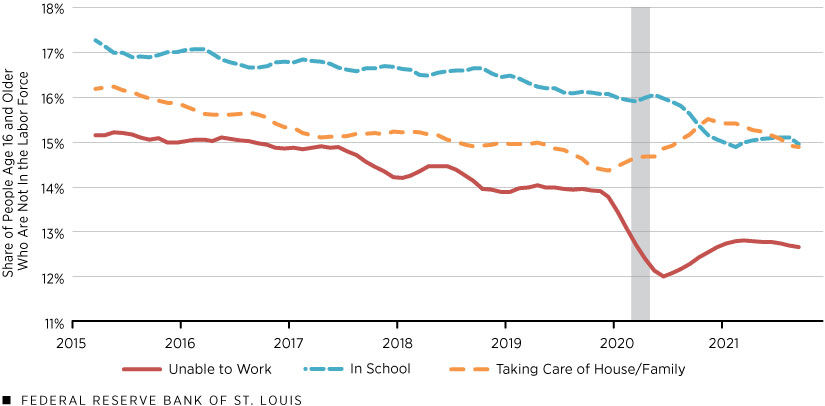
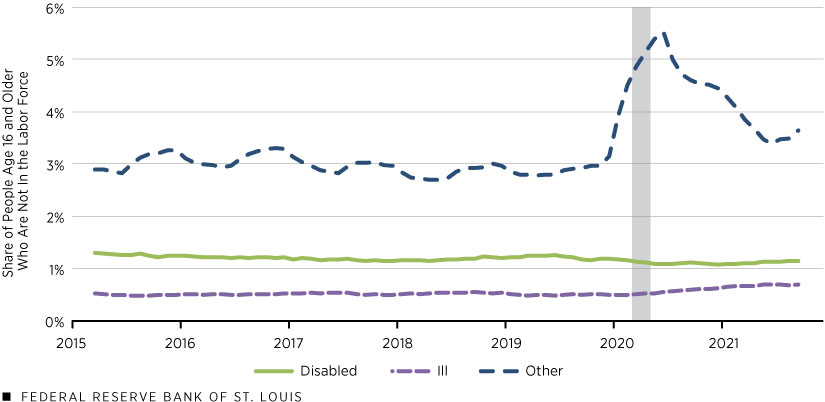
SOURCES FOR THREE FIGURES ABOVE: Current Population Survey and authors’ calculations.
NOTES FOR THE THREE FIGURES ABOVE: The percentages are six-month moving averages. The data start in March 2015 and end in September 2021. The gray shading indicates the COVID-19 recession.
We now explore further what changes have occurred in the “retirement” and “taking care of house/family” categories. These activities are frequently cited as reasons people have not gone back to work during the pandemic.
Retirement
Has the pandemic spurred more retirement than in previous years? An obvious first place to look is the share of the populationAge 16 and older. that reports being retired. The next figure shows how this has evolved over the last several years. As also pointed out by Miguel Faria-e-Castro’s 2021 Economic Synopses essay, there has been an acceleration in retirements during the pandemic. He estimates that, had the proportion of retired individuals continued to increase at the same pre-pandemic rate, there would be about 2.4 million fewer retirements than there are now.
Retirees as a Share of the U.S. Working-Age Population
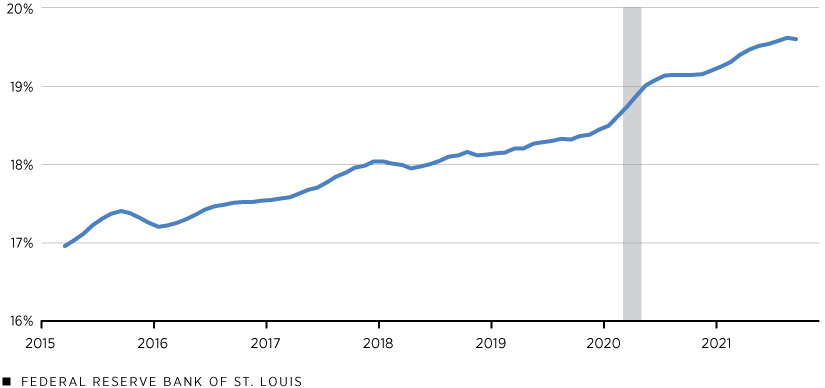
SOURCES: Current Population Survey and authors’ calculations.
NOTES: The percentages are six-month moving averages. The data start in March 2015 and end in September 2021. The gray shading indicates the COVID-19 recession.
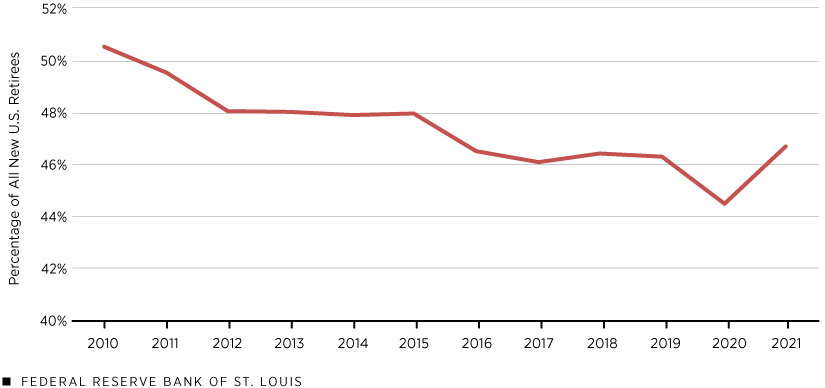
Do these extra retirements differ from previous retirements? One possibility is that the pandemic induced people to retire at earlier ages, which means that we should see a change in the age composition of new retirees.
The next figure plots the share of new retirees (those who left the labor force to retire in a given month) who are younger than 65. Over the past decade, the fraction of “young” retirees had been on the decline but saw a modest reversal in 2021 back to 2015-16 levels, from 44.5% to 46.7%. This suggests that age may have been a small factor more recently, although pinpointing which retirements would have not occurred in the absence of the pandemic would require a more careful analysis.
Share of New Retirees Younger than 65
SOURCES: Current Population Survey and authors’ calculations.
Taking Care of House/Family
Next, we turn to home and child care considerations. Early in the pandemic, many people, especially women, were forced to leave their jobs when schools and day care centers were shut down. To what extent did the pandemic produce a persistent shift in the balance between work and child care? The next figure plots the proportion of the population that reports being out of the labor force because of home care/family care. It was on a downward trend until 2020, after which it spiked and has remained high.
Share of the U.S. Working-Age Population Who Aren’t in the Labor Force because of Home/Family Care
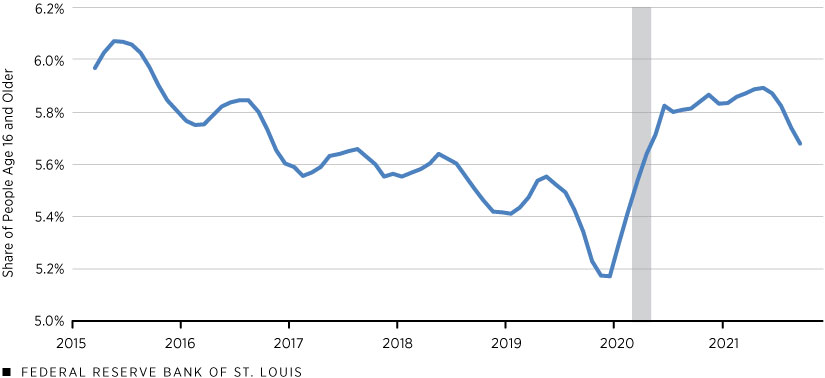
SOURCES: Current Population Survey and authors’ calculations.
NOTES: The percentages are six-month moving averages. The data start in March 2015 and end in September 2021. The gray shading indicates the COVID-19 recession.
Gender Differences in Home Care/Family Care
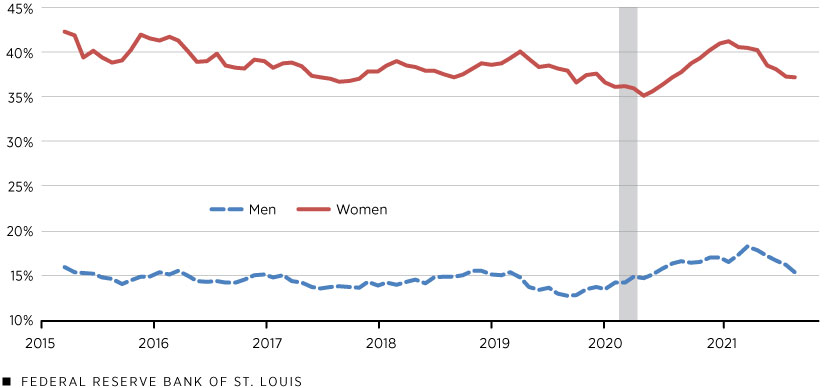
To further quantify the shift from work to home care/family care, we looked at people leaving the labor force in a given month and then calculated the share of those leaving to “take care of house/family.” The next figure plots this percentage for both men and women.
People Taking Care of Home/Family as a Share of Those Leaving the Labor Force: By Gender
SOURCES: Current Population Survey and authors’ calculations.
NOTES: The percentages are six-month moving averages. The data start in March 2015 and end in September 2021. The gray shading indicates the COVID-19 recession.
The different levels of the two series highlight the different tendencies of men and women to enter into home care/family care: Conditional on exiting the labor force, 37% of women go to home care/family care, versus around 16% for men. It turns out that for both genders, this tendency increased during 2020; that is, both genders became more likely to be occupied with home care/family care concerns during the pandemic. Since early 2021, this tendency has been declining again.
As it stood in December 2021, 21.5% of female nonparticipants reported being out for home care and family care reasons, versus only 5.1% of men. These are little changed from the pre-pandemic numbers of 20.8% and 4.2%, respectively, suggesting some limited lingering effects for both genders.
To conclude, our analysis of the out-of-labor-force activities in the CPS reveals that shifts toward retirement and home care/family care have driven the shortfall in labor force participation. This squares well with anecdotal evidence. Our findings also suggest that the shifts are not limited to a certain age range for retirement or a certain gender for home care/family care.
References
- Faria-e-Castro, Miguel. “The COVID Retirement Boom” Economic Synopses, Oct. 15, 2021, No. 25.
Endnotes
- The “not in labor force” survey category is split into “retired,” “unable to work” and “other.” The people who report “other” are asked a follow-up question with more options. These encompass the latter six options: “in school,” “taking care of house/family,” “disabled,” “ill,” “other” or “not in universe.”
- Age 16 and older.


Views expressed in Regional Economist are not necessarily those of the St. Louis Fed or Federal Reserve System.
For the latest insights from our economists and other St. Louis Fed experts, visit On the Economy and subscribe.
Email Us