Access to Traditional Credit in the U.S. and the Fed’s Eighth District
This section presents findings from the analysis of Consumer Credit Panel data for the nation and Eighth Federal Reserve District,Headquartered in St. Louis, the Eighth District covers all of Arkansas, most of Missouri, and parts of Illinois, Indiana, Kentucky, Mississippi and Tennessee. focusing on adults in low- and moderate-income census tracts. The analysis presents state-level findings. See Appendix A for information about the data and methodology.

Credit scores assess the likelihood that individuals will be delinquent on their loan payments.Donghoon Lee and Wilbert van der Klaauw. “An Introduction to the New York Fed Consumer Credit Panel.” Federal Reserve Bank of New York, Staff Report No. 479, November 2010. A high credit score represents less risk to lenders than a low credit score. Credit scores are a snapshot in time of an individual’s creditworthiness and are based on an individual’s credit history and reports. Credit reports include information about an individual’s credit history and credit record, which contain information such as number and type of loans, length of credit history, credit utilization, and on-time and delinquent payments.Consumer Financial Protection Bureau. “Who Are the Credit Invisibles? How to Help People with Limited Credit Histories” (PDF). December 2016. National credit reporting agencies use this information to calculate credit scores.
In this report, an individual’s access to credit is measured in two ways: (1) whether an individual has a credit score, and (2) the quality of the credit score. An individual with a prime credit score, over 660, has more access to traditional credit than an individual without a credit score or with a lower score, like a subprime score. Individuals without a credit file or no credit score have the least access to traditional credit. The lower a person’s credit score, the more likely it is that individual’s access to traditional credit will be hindered by denials or less-favorable terms, like high interest rates.
Adults without a Credit Score
In 2025, an estimated 12.7 million (4.9%) adults in the nation do not have a credit score. Figure 1 shows that states in the Eighth District, except for Tennessee, have a higher percentage of adults without a credit score than the nation. More than 2.1 million (6.3%) adults in Eighth District states have no credit score, which limits their access to traditional credit. Almost 1 in 10 (9.3%) adults in Arkansas do not have a credit score—the highest rate of any Eighth District state. Mississippi and Kentucky closely follow with 8.8% and 8.6%, respectively, of adults without a credit score. Illinois’ and Indiana’s percentages of adults without a credit score are slightly higher than the nation’s. At 3.8%, Tennessee has the lowest percentage of adults without a credit score among states in the Eighth District.
Figure 1: Share of Adults with No Credit Score, 2025:Q1
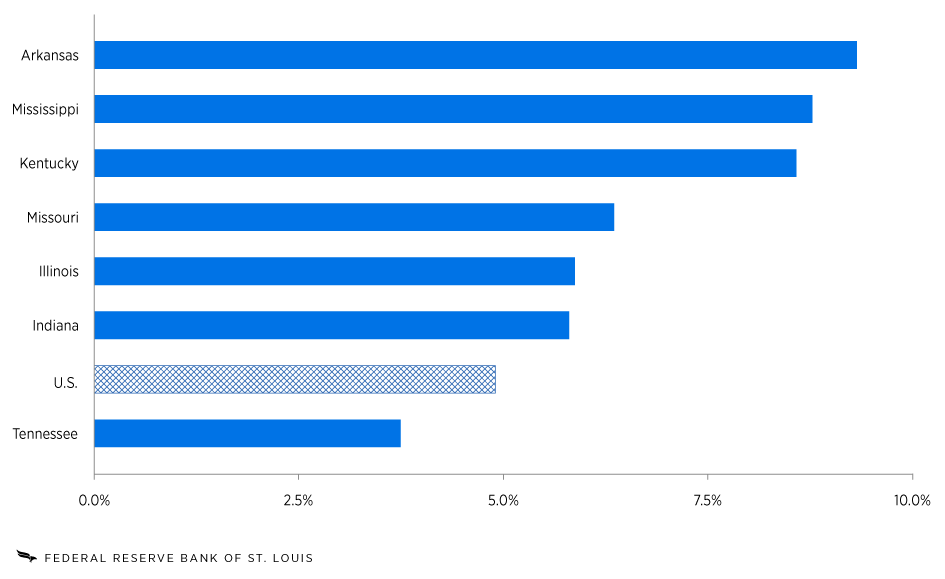
SOURCES: New York Fed Consumer Credit Panel/Equifax, American Community Survey (ACS) Five-Year Estimates Data Profiles (2019-23) and author’s calculations.
The percentage of adults without a credit score decreased in recent years. In the nation, the percentage of adults without a credit score dropped considerably from 8.2% in the first quarter of 2023 to 4.9% in the first quarter of 2025. The percentage of adults without a credit score also fell in Eighth District states, with Tennessee and Indiana recording the largest decreases, at 3.6 percentage points and 3.5 percentage points, respectively. Mississippi had the smallest decrease among Eighth District states, at 2 percentage points. It is possible that decreases in the percentage of adults without a credit score during this period occurred because of an increase in adults with bank accounts or economic growth, which might spur access to traditional credit.Consumer Financial Protection Bureau. “Technical Correction and Update to the CFPB’s Credit Invisibles Estimate” (PDF). June 2025.
Within Eighth District states, the percentage of adults without a credit score decreases as income level increases, as shown in Figure 2. Nearly 21% of individuals living in low-income census tracts and 11.8% of those living in moderate-income census tracts did not have a credit score in the first quarter of 2025. Comparatively, 1.7% of adults living in upper-income census tracts do not have a credit score.
Figure 2: Share of Adults with No Credit Score in the Eighth District by Census Tract Income Level, 2025:Q1
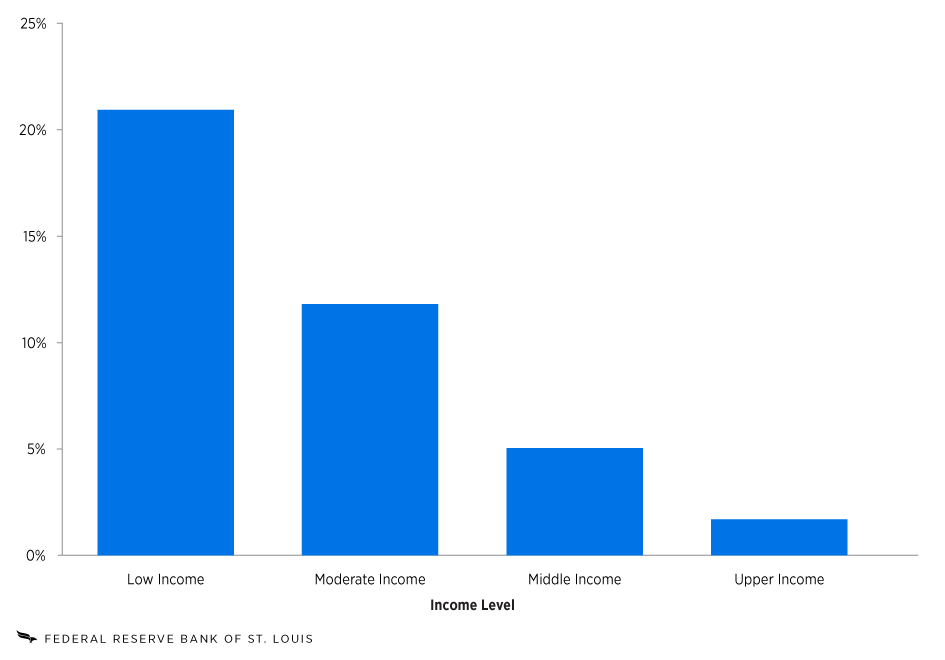
SOURCES: New York Fed Consumer Credit Panel/Equifax, Federal Financial Institutions Examination Council 2024 U.S. Census Flat File and author’s calculations.
Adults with a Subprime Credit Score
Figure 3 shows that, nationally, an estimated 23.9% of adults with a credit record had a subprime credit score in the first quarter of 2025. The percentage of adults with a credit record and a subprime credit score was higher among Eighth District states (25.5%) than it was for the U.S. and represented more than 9.2 million adults. Illinois is the only Eighth District state that has a smaller percentage of adults with a subprime credit score than the nation does. Mississippi (36.7%) and Arkansas (29.5%) had the highest percentages of adults with a subprime credit score among Eighth District states. The share of adults with a subprime credit score in Kentucky and Tennessee was about 3 percentage points higher than in the nation.
Figure 3: Share of Adults with a Subprime Credit Score, 2025:Q1
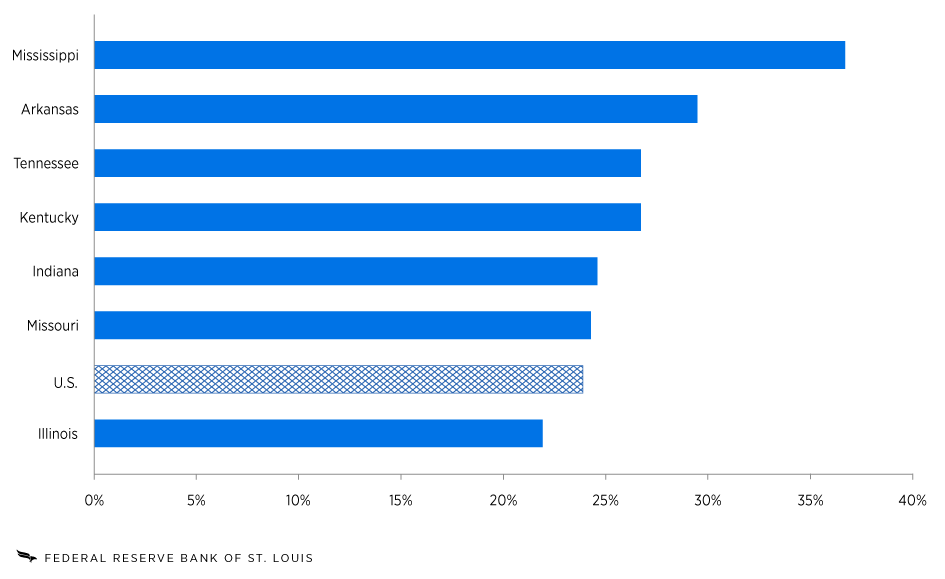
SOURCES: New York Fed Consumer Credit Panel/Equifax and author’s calculations.
Since the first quarter of 2023, the change in the percentage of adults with a subprime credit score was mixed across states but was not substantial either for the nation or for Eighth District states as a whole. Most notably, Indiana had a slight increase of 1 percentage point of adults with credit scores under 660.
In Eighth District states, about one-quarter (26.4%) of adults living in low-income census tracts had a subprime credit score below 580, and another 26.8% had a subprime credit score from 580 to 659. (See Figure 4.) While most adults living in moderate-income census tracts had a prime or super-prime credit score (over 660), 20.2% of adults in those census tracts had a subprime credit score below 580. In middle-income census tracts, 71.5% of adults had at least a prime credit score; in fact, 55.8% had a super-prime credit score (720 or above). About two-thirds (67.5%) of adults living in upper-income census tracts had a super-prime credit score; 8.1% of these adults, however, had a subprime credit score below 580.
Figure 4: Credit Score Distribution in the Eighth District across Census Tract Income Levels, 2025:Q1
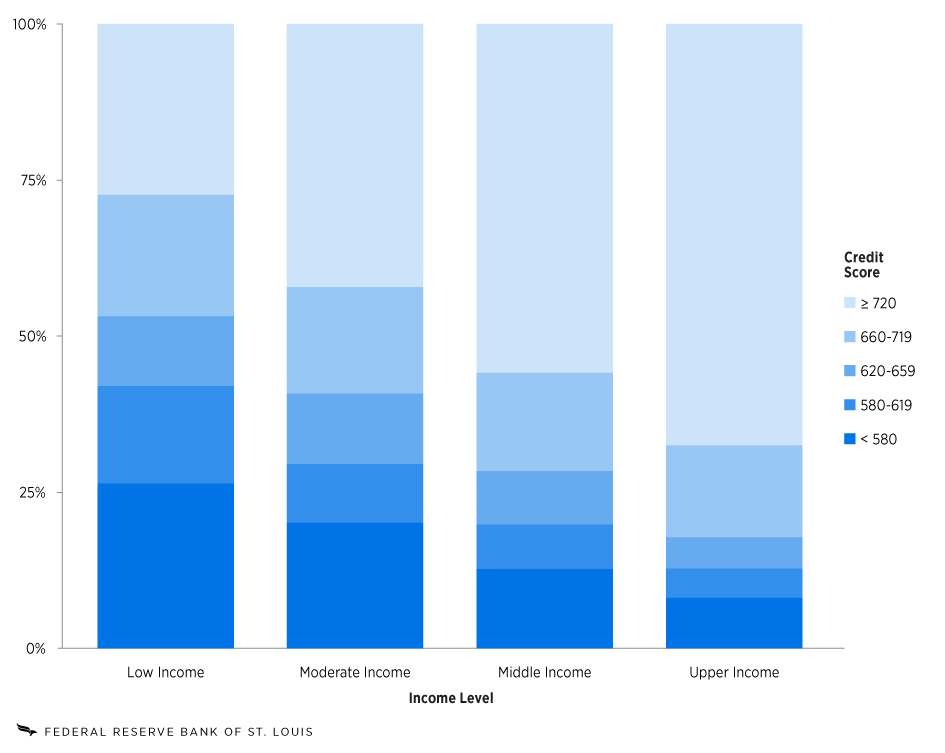
SOURCES: New York Fed Consumer Credit Panel/Equifax, Federal Financial Institutions Examination Council 2024 U.S. Census Flat File and author’s calculations.
The average credit score for adults in Eighth District states, except for Illinois and Indiana, is lower than for adults in the nation. (See Table 1.) Mississippi has the lowest average credit score in the Eighth District, followed by Arkansas. For the nation and each state, the average credit score increases with income level.
| Total Population | Low Income | Moderate Income | Middle Income | Upper Income | |
|---|---|---|---|---|---|
| U.S. | 716 | 655 | 685 | 717 | 745 |
| Arkansas | 700 | 641 | 658 | 703 | 724 |
| Illinois | 721 | 661 | 690 | 723 | 754 |
| Indiana | 716 | 665 | 677 | 717 | 746 |
| Kentucky | 708 | 646 | 681 | 707 | 737 |
| Missouri | 714 | 630 | 693 | 717 | 740 |
| Mississippi | 670 | 611 | 643 | 667 | 703 |
| Tennessee | 710 | 634 | 671 | 713 | 742 |
| SOURCES: New York Fed Consumer Credit Panel/Equifax and author’s calculations. | |||||
Both Figure 4 and Table 1 show that the credit scores of adults by income level tend to represent different credit score ranges: Generally, low-income census tracts correspond to subprime credit scores, moderate- and middle-income census tracts correspond to prime credit scores, and upper-income census tracts correspond to super-prime credit scores. Of adults living in upper-income census tracts in Eighth District states, only those in Mississippi have an average credit score below super-prime.
Conclusion
About 30% of U.S. adults and 34% of adults in the Eighth District have limited access to traditional credit. This analysis shows that some Eighth District states have less access to credit than the nation and that access to credit differs by income level. Among Eighth District states, adults in Mississippi and Arkansas appear to have the least access to credit, while adults in Illinois have the greatest access to credit. Overall, more adults seem to have limited access to credit because of a low credit score rather than no credit score. The percentage of adults without a credit score and the percentage of adults with subprime credit scores decrease as income level increases. Similarly, average credit scores increase with income level. In Eighth District states, adults living in low- and moderate-income census tracts have the least access to traditional credit.
The state of access to credit in the Eighth District, and how it compares with the nation, sets the stage for the accompanying qualitative analysis. In particular, the comparably high percentage of adults in low- and moderate-income communities without a credit score and with a subprime credit score illustrates their limited access to credit. A clear understanding of factors that limit credit, and to what extent, provides context for an in-depth discussion about how low- and moderate-income individuals interact with institutions to access financial services. The next section of this report will add nuance and depth to the quantitative findings above.
- Headquartered in St. Louis, the Eighth District covers all of Arkansas, most of Missouri, and parts of Illinois, Indiana, Kentucky, Mississippi and Tennessee.
- Donghoon Lee and Wilbert van der Klaauw. “An Introduction to the New York Fed Consumer Credit Panel.” Federal Reserve Bank of New York, Staff Report No. 479, November 2010.
- Consumer Financial Protection Bureau. “Who Are the Credit Invisibles? How to Help People with Limited Credit Histories” (PDF). December 2016.
- U.S. Census Bureau. Glossary. Last updated April 11, 2022.
- Federal Financial Institutions Examination Council. Online Data Dictionary. Last updated June 18, 2025.
- Consumer Financial Protection Bureau. “Technical Correction and Update to the CFPB’s Credit Invisibles Estimate” (PDF). June 2025.
The analysis begins with an examination of the New York Fed’s Consumer Credit Panel, which is derived from randomly selected, anonymized Equifax consumer credit reports, to describe the state of access to credit in the nation and Eighth District states. The database contains a nationally representative 5% sample of all adults with a Social Security number and a credit report. Consumer credit data do not include income and demographic information about borrowers. Instead, consumer credit data were merged with the Federal Financial Institutions Examination Council’s 2024 U.S. Census flat files to approximate income using the income level of a borrower’s 2020 census tract. The populations for the nation and states come from the American Community Survey’s 2019-23 ACS Five-Year Estimates Data Profiles.
Credit access is measured at the individual level, with credit risk scores, and analyzed for the first quarters of 2023 to 2025. Descriptive statistics summarize credit access in the U.S. and states of the Eighth District. Records were excluded from the analysis if the borrower was deceased, was over the age of 100 or had a missing birth year. Borrowers were also excluded if they had an address outside the contiguous U.S. The place-based analysis excludes borrowers with nonresidential addresses.