Federal Funding in Response to COVID-19

At the onset of the COVID-19 crisis, the federal government moved quickly to enact four major pieces of legislation to help offset potential economic, health and societal impacts of the global pandemic. As of Oct. 1, 2020, roughly $2.59 trillion in new budgetary resources had been made available for federal agencies.
An analysis from the U.S. Department of the Treasury’s Data Lab in collaboration with the St. Louis Fed explores how supplemental funding for COVID-19 makes its way from Congress to the American public and the economy. (At the time of publication, this data analysis reflected fiscal year 2020, or Oct. 1, 2019, to Sept. 30, 2020.)The Data Lab team is working on updating data from the Consolidated Appropriations Act, 2021 (Public Law No. 116-260) as well as data from fiscal year 2021 (Oct. 1, 2020 to Sept. 30, 2021).
The passage and signing of the four acts marked the funding phases.
Early in the Pandemic: COVID-19 Federal Funding in Spring 2020
Phase 1: The Coronavirus Preparedness and Response Supplemental Appropriations Act
Signed into law March 6, this act provided $8.2 billion in emergency funding for federal agencies. The funding was specifically for medical research, the development of vaccines and therapies, disaster loans, and foreign assistance.
Phase 2: Families First Coronavirus Response Act
Signed into law March 18, this act allocated $19 billion to support coronavirus testing; federal medical leave benefits for individuals, families and employers; enhanced unemployment insurance benefits; Medicare expansion; and supplemental food-security funding.
Phase 3: Coronavirus Aid, Relief, and Economic Security Act (CARES Act)
Enacted March 27, the CARES Act is the largest relief bill in American history, estimated at $2.08 trillion. The act was established to focus on the economic impact the pandemic was having on families and businesses, with most financial assistance targeted to companies, as well as state and local governments. For example, the act created the Paycheck Protection Program, which provided funds to small businesses to maintain payroll, rehire laid-off employees, and cover additional items like rent and utilities.
| Legislation | Amount | |
|---|---|---|
| Coronavirus Preparedness and Response Supplemental Appropriations Act | $8.2 billion | |
| Families First Coronavirus Response Act | $19 billion | |
| Coronavirus Aid, Relief, and Economic Security Act | $2.08 trillion | |
| Paycheck Protection Program and Health Care Enhancement Act | $483 billion | |
| SOURCE: October 2020 analysis by the U.S. Department of the Treasury’s Data Lab, “How is the federal government funding relief efforts for COVID-19?” | ||
The act also provided economic relief to individuals and families. This included direct payments to mitigate income loss from the pandemic. The CARES Act also expanded unemployment coverage to offset lost wages and various payroll tax benefits to offset certain expenses.
Phase 3.5: Paycheck Protection Program and Health Care Enhancement Act
An amendment to the CARES ACT, this law, signed on April 24, totaled around $483 billion and provided additional support for small businesses, government agencies and institutions. This included additional funding for Economic Injury Disaster loans and grants and for the Paycheck Protection Program. An additional $100 billion was allocated to medical care and research, with a large portion going to the Public Health and Social Services Emergency Fund.
How Supplemental Spending Reaches Recipients
As discussed in a previous blog post, federal spending can be classified into two major categories:
- Mandatory: Spending that is designated by prior laws or established by acts of Congress that dictate the amount of money budgeted for spending each year.
- Discretionary: Spending voted on by Congress through the appropriations process and formally approved by the U.S. president.
When there is an urgent need for funding, Congress can enact supplemental appropriations in addition to those the federal government already provides and uses for emergencies or exceptional circumstances. One example of appropriations already provided is funding for Federal Emergency Management Agency (FEMA) responses to natural disasters. Here are some of the steps:
- A supplemental appropriations bill goes through the usual appropriations process, where Congress examines and votes on funding levels and then sends the bill to the president for final approval or veto.
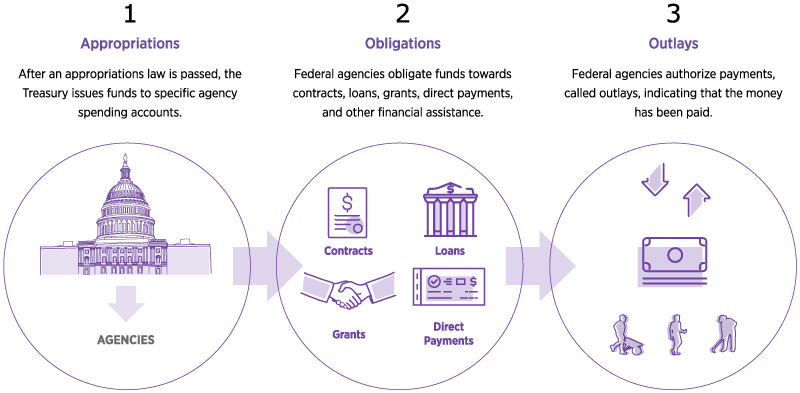
- After the special appropriations law passes, the Treasury Department reviews the new legislation and issues funds to agencies’ spending accounts–basically giving legal authority to begin using the money for the purpose assigned in the law.
- Money is spent by federal agencies through obligations, or agreements on how they will use funds for a particular purpose. This can be through contracts, direct payments, grants or loans. An example could be an agency setting aside funds for a contract with a vendor to purchase personal protective equipment, such as masks.
- Obligations do not necessarily mean the money has been paid, only that the agency has promised to pay the funds. In many cases, a receipt of funds may be required to do something first, such as delivering equipment or supplies. Once that happens, an agency can process a payment–also known as an outlay.
- Federal agencies authorize the Treasury Department to issue payments to individuals, businesses or other organizations.
The image below, which is from the Data Lab analysis, illustrates some of the steps.
How Federal Dollars Move from Congress to the American People

This image is courtesy of an October 2020 analysis by the U.S. Department of the Treasury’s Data Lab, “How is the federal government funding relief efforts for COVID-19?”
How Federal Funds Have Been Spent
As of Oct. 1, 2020, 90% of the $2.59 trillion in COVID-19 funding was appropriated to four federal agencies: the Treasury, Health and Human Services, and Labor departments, and the Small Business Administration.
Of that money, $1.27 trillion was allocated to lending and could be used to generate an estimated $3.92 trillion in loans and loan guarantees to businesses and individuals, as noted in the Data Lab analysis.
In addition, as of Oct. 1, the federal government made $1.79 trillion in obligations, of which $1.62 trillion was outlaid, according to calculations from federal agencies’ monthly reporting to the Treasury’s Governmentwide Treasury Account Symbol Adjusted Trial Balance System (GTAS).
For more information about federal government finances, check out Your Guide to America’s Finances, an interactive analysis that gives an overview.
1The Data Lab team is working on updating data from the Consolidated Appropriations Act, 2021 (Public Law No. 116-260) as well as data from fiscal year 2021 (Oct. 1, 2020 to Sept. 30, 2021).
More to Explore
- Regional Economist: Monetary Policy and Fiscal Policy Responses to the COVID-19 Crisis
- Open Vault blog: How the Fed Has Responded to the COVID-19 Pandemic
- Open Vault blog: Where Federal Revenue Comes from and How It’s Spent
This blog explains everyday economics and the Fed, while also spotlighting St. Louis Fed people and programs. Views expressed are not necessarily those of the St. Louis Fed or Federal Reserve System.
Email Us


