


The NAIRU: Tailor-Made for the Fed?
According to a recent editorial published in The Wall Street Journal, Federal Reserve monetary policy relies inordinately upon a concept known as NAIRU—the Non-Accelerating Inflation Rate of Unemployment. According to the June 15 editorial:
"...there are signs the Federal Reserve is worrying about inflation for the wrong reasons. While modern markets keep trying to move on to the 21st century, the Fed won't let go of such hand-cranked notions as the Phillips curve, or NAIRU—a concept as dense as its name."
Although the monetary authorities regularly use models based on a NAIRU/Phillips curve framework—that is, to forecast inflation, which figures prominently in monetary policy decisions—do they rely upon them to the degree that some believe?
The Phillips Curve: Whole Cloth or Hair Suit?
The modern Phillips curve has evolved into a catch-all term that describes the causality between changes in the aggregate price level (inflation) and the strength of aggregate demand. Although the curve has had a controversial history in the economics profession, it nonetheless underpins the short-term inflation process of most large-scale macroeconomic forecasting models.1 The relationship is named for New Zealand economist A.W. Phillips, who showed how the unemployment rate varied inversely with the rate of change in nominal wages in the United Kingdom from 1861 to 1957. Unlike Phillips' original framework, the modern Phillips curve now alleges an inverse trade-off between the unemployment rate and inflation.2
Initially, some economists believed that a stable relationship existed between unemployment and inflation. In other words, if the unemployment rate was higher than what policy-makers thought it should be, then they could reliably boost aggregate demand—by increasing the growth of the money supply—without causing inflation to accelerate. But as Nobel Prize-winning economist Milton Friedman warned in 1967, efforts to lower the unemployment rate through aggressive monetary expansion would eventually result in a higher inflation rate only. Friedman was later proven correct, as both inflation and unemployment rose simultaneously during the 1970s.
In the hopes of salvaging something of the framework, Phillips curve proponents devised two important innovations. First, that expectations matter: Specifically, that the current level of inflation is importantly influenced by firms' and individuals' expectation of future inflation rates. Second, the original measure of aggregate demand—the civilian unemployment rate—was replaced by something called the output gap. The output gap is the difference between measured real GDP and the (estimated) level of real GDP that could exist based on the economy's available amount of capital and labor inputs, and on how productive those inputs are. This is where NAIRU enters the picture.
Inflation, the Output Gap and NAIRU
Many of those in the business of forecasting inflation rates—for example, the Board of Governors—use large-scale macroeconometric models based on a Phillips curve framework. The basic premise behind the modern Phillips curve is that this year's inflation rate is, to a large extent, determined by last year's output gap. So, how does NAIRU enter the analysis? NAIRU is the unemployment rate that would result when the output gap is zero; that is, when the economy is growing at its potential with no unusual wage and price pressures.3 But when aggregate demand growth is such that the demand for labor temporarily pushes the unemployment rate below NAIRU, measured real GDP is greater than potential GDP, and a positive output gap opens up. When this happens, upward pressure on wages results, which is then transmitted into higher prices for goods and services. This does not occur immediately, however, since price changes at the individual firm (micro) level take time to work their way into price changes at the aggregate (macro) level.
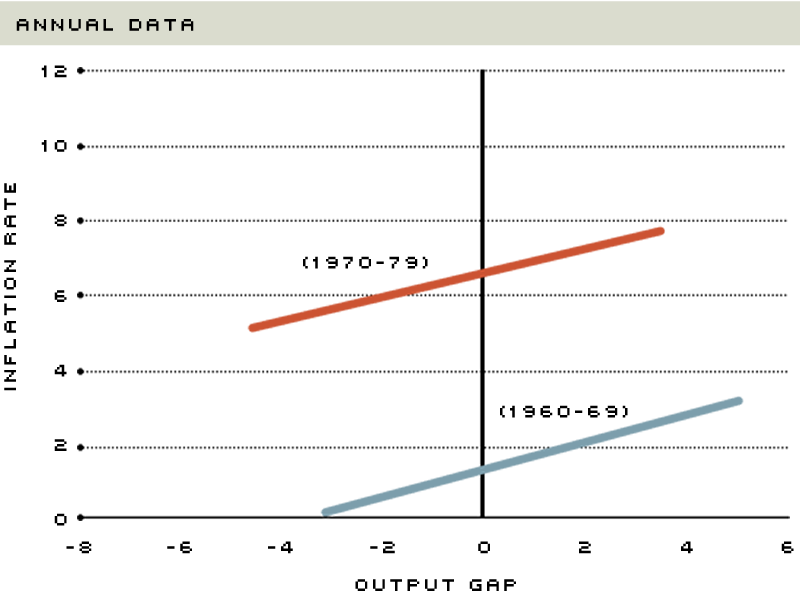
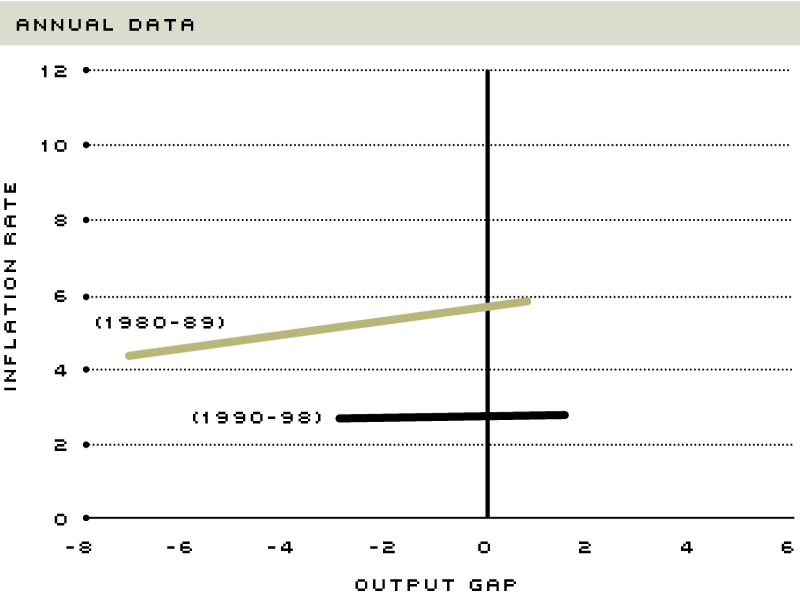
The accompanying chart, which includes all combinations of the (lagged) U.S. output gap and the inflation rate from 1960 to 1998, shows how the Phillips curve has evolved over time.4 From 1960 to 1969, just as proponents believed, the Phillips curve displayed a positive slope: The more real GDP rose above potential GDP, the further the reported unemployment rate fell below NAIRU, and, thus, the more inflation rose. During the 1970s and 1980s, though, as indicated by the progressively flatter slope of the line, the relationship began to break down. During the 1990s, the relationship between NAIRU and inflation disappeared, and the Phillips curve became a virtually flat line. Not only that, but if the observations for 1990 and 1991—years of relatively high inflation and unemployment—were removed, the slope would be negative.5
The Modern Phillips Curve
What Worked in the '60s and '70s...
...Looks Broken down in the '80s and '90s
NOTE: The inflation rate is calculated from the PCE chain-type index.
The charts show the relationship between inflation and the output gap for each of the last four decades (the Phillips Curve). Since the early 1980s, the Phillips Curve has shifted back to where it was during the 1960s. It has also become flatter. This means that expected inflation has returned to its '60s level, and that the Phillips Curve trade-off has become much weaker.
Phillips curve proponents argue that a series of favorable supply shocks has temporarily distorted the unemployment rate/inflation nexus.6 These include the dramatic reduction in health care costs between 1993-95 and the plunge in crude oil prices between late 1996 and late 1998. Phillips curve proponents argue that, once these factors are accounted for, the relationship still holds. Others, however, argue that, unless these factors can be identified beforehand, the Phillips curve relationship cannot be reliably exploited by the central bank to forecast inflation.7
Is the Fed in a NAIRU Straitjacket?
With an uncertain—if any—trade-off between inflation and the output gap in the 1990s, monetary policy-makers have appeared to change their view of the inflation process, and reacted accordingly. Since August 1987, the FOMC raised or lowered the federal funds rate target 49 times, with decreases in the target outnumbering increases 30 to 19. If the FOMC relies heavily on Phillips curve inflation forecasts, then more increases in the fed funds rate should be seen when the actual monthly unemployment rate falls below NAIRU—or, equivalently, when the output gap is positive. Similarly, when the unemployment rate rises above NAIRU (a negative output gap), we would expect to see the FOMC moving to lower the fed funds target rate.
In the late 1980s and early 1990s, this was generally the case. From March 1988 to February 1989, for instance, with strong economic growth pushing the unemployment rate below NAIRU, the FOMC raised the fed funds target rate from 6.75 percent to 9 percent. But as the economy began to slow, eventually entering into a recession in July 1990, the FOMC reversed course, eventually reducing the target rate to 3 percent in September 1992, which is where it stayed until February 1994. Even though there was still a negative output gap (actual unemployment was above NAIRU) in early 1994, the FOMC, in what would become known as the "pre-emptive strike against inflation," pushed the fed funds rate target back up to 6 percent by February 1995. Moreover, although the unemployment rate has persisted well below NAIRU since May 1995, the FOMC has moved to increase the fed funds rate three times since then (in March 1997, June 1999 and August 1999). In fact, because of the Asian crisis and Russian debt default last year, there have been twice as many reductions than increases in the funds rate over this period.
In short, during the past four years or so it appears that FOMC policy-makers have—more often than not—ignored the policy prescriptions of the modern Phillips curve. This should not be too surprising given the poor performance of most forecasting models during this period. So, what have policy-makers been looking at when forecasting inflation? There is some evidence that they have paid more attention to expectations. That is, if markets expect inflation to remain low for the foreseeable future, and expectations matter more than the output gap, as some believe, then policy-makers will be less likely to view a low unemployment rate with the alarm that they have in the past. Either way, using the Phillips curve framework to forecast inflation, and thus potential FOMC policy moves, is a process fraught with difficulty.
Endnotes
- Most economists believe that, in the long run, there is no trade-off between inflation and unemployment. In other words, over time, the average unemployment rate, or natural rate, is determined by microeconomic factors like unionization rates or minimum wage laws. Likewise, over the long haul, most economists also believe that inflation is determined principally by the amount of money created by the central bank. [back to text]
- The leap from changes in wage rates to the inflation rate was assumed to occur by some sort of mark-up process--that is, employers passed along higher wage costs to their customers. Humphrey (1986) is an excellent reference on how the Phillips curve evolved over time. [back to text]
- NAIRU is not the same as Friedman's natural rate of unemployment. NAIRU stresses the hypothesized short-term relationship between inflation and the unemployment rate. Friedman's rate, as noted in Footnote 1, is the rate that would occur over the long run. [back to text]
- This specification follows the one hypothesized by Stanford Professor John Taylor. [back to text]
- The chart shows how the expected inflation rate has changed over time. This is seen as the point where the Phillips curve intersects the vertical line: Since the early 1980s, the Phillips curve has steadily shifted back down from where it was during the 1970s. [back to text]
- See Meyer (1999). [back to text]
- See Rasche (1998) and the Winter 1997 edition of The Journal of Economic Perspectives. [back to text]
References
Humphrey, Thomas M. From Trade-Offs to Policy Ineffectiveness: A History of the Phillips Curve. Federal Reserve Bank of Richmond (October 1986).
Meyer, Laurence H. "The Global Economic Outlook and Challenges Facing Monetary Policy Around the World," Remarks at the Annual Dinner of the Society of Business Economists, London, England, February 25, 1999.
Phillips, A.W. "The Relation between Unemployment and the Rate of Change of Money Wage Rates in the United Kingdom, 1861-1957," Economica (November 1958), pp. 283-99.
Rasche, Robert H. "Money and Real Output," in Money, Prices and the Real Economy, Geoffrey Wood, ed. (Northampton, MA: Edward Elgar, 1998).
Symposium on the Natural Rate of Unemployment. The Journal of Economic Perspectives (Winter 1997), pp. 3-108.

Views expressed in Regional Economist are not necessarily those of the St. Louis Fed or Federal Reserve System.
For the latest insights from our economists and other St. Louis Fed experts, visit On the Economy and subscribe.
Email Us