


A Look at Japan's Slowdown and Its Turnaround Plan
The Japanese economy has been struggling with low growth and low inflation for several years (or even decades). These two symptoms are present in several developed economies, including the U.S.[1] In this article, we analyze the Japanese economic experience, reviewing the headwinds and the recent policies implemented. We show the main differences and similarities that Japan has with the U.S. and also compare Japan's performance with South Korea's. The case of South Korea is interesting because the growth experience is similar to Japan's between 1970 and 1990, but South Korea didn't suffer a slowdown in the years after that, as Japan did.
The economic history of Japan over the past 40 years can be divided into two subintervals: before and after 1990. In the first period, gross domestic product (GDP) grew at an annual rate of about 4.5 percent, and the growth was persistent. This trend stopped abruptly in the 1990s, after which the economy grew at an annual rate of less than 1 percent until 2011.
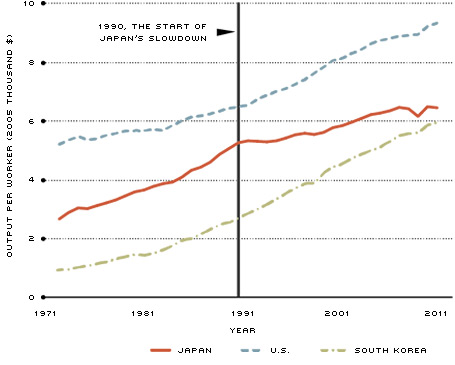
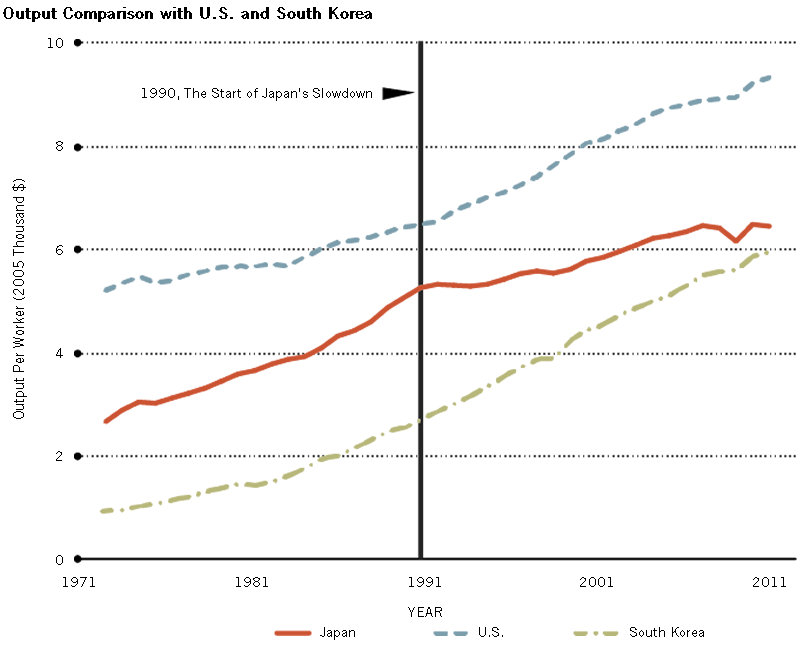
This break in the growth experience of Japan can also be seen in terms of output per worker. Figure 1 compares the patterns in output per worker in Japan with those in the U.S. and South Korea. For the period between 1971 and 2011, the case of Japan is clearly different from that of the U.S. and South Korea. Until 1990, Japan was growing fast and catching up with the U.S. However, starting in 1990 the Japanese growth rate slowed down and its gap with the U.S. widened. During the same period, South Korea sustained fast growth and narrowed its gap with Japan and the U.S. In particular, between 1970 and 1990, Japan's output per worker grew at an annual rate of about 3.6 percent, whereas corresponding rates for the U.S. and South Korea were 1.3 and 5.6 percent. From 1990 to 2011, Japan's output per worker rose at a rate less than 1 percent; in comparison, the annual rate of growth in the U.S. was 1.7 percent and in South Korea was 3.8 percent.
What caused in Japan such a striking change in the trend that was dominant for at least two decades? It's only logical to think that the causes are connected to the three main drivers of growth: capital, labor and total factor productivity (TFP). Capital captures the machinery and equipment that are used by businesses in their operations. Labor captures workers' input in production operations and is measured as the average hours worked by people engaged in production as well as their skill level. TFP measures the efficiency of a country in producing output with given levels of capital and labor. If Country A and Country B have the same amount of capital and (quality-adjusted) labor, but Country A produces more, then it must be that Country A has higher TFP. With that framework in mind, we can compute how much of the Japanese growth (or lack thereof) was accounted for by the changing patterns in capital, labor and TFP.
Growth Accounting
Let's look at the changes in total output, capital and labor in the intervals 1970-1990, 1990-2007 and 2007-2011.[2] Capital is an estimate of the stock of accumulated investments. Labor is the total labor force, adjusted by the number of hours worked and education. The growth rate of each factor is adjusted, using a measure of its importance in the aggregate economy, such that the sum of the growth rates of capital, labor and TFP is equal to the growth rate of output.
As a result of this exercise, we should expect that, if TFP had no effect on the growth rate of output, the growth rate of the economy must be made up of the contribution of the growth rate in capital plus the contribution of the growth rate in labor. Needless to say, such equality does not hold in general, giving economists an idea of how important TFP is in accounting for the growth experience of the economy. The top panel of the table gives the results of this exercise for Japan.[3] The middle and bottom panels show the results for the U.S. and South Korea, respectively.
Table 1
Growth Accounting
|
YEARLY GROWTH RATE
|
||||
|---|---|---|---|---|
|
Total output
|
Capital stock
|
Labor input
|
Total factor productivity
|
|
|
Japan
|
||||
| 1970-1990 |
4.45
|
2.35
|
0.73
|
1.37
|
| 1990-2007 |
1.24
|
0.85
|
–0.06
|
0.44
|
| 2007-2011 |
–0.79
|
0.13
|
–1.24
|
0.33
|
|
U.S.
|
||||
| 1970-1990 |
3.18
|
0.98
|
1.45
|
0.75
|
| 1990-2007 |
2.95
|
0.87
|
0.90
|
1.18
|
| 2007-2011 |
0.15
|
0.32
|
–0.62
|
0.46
|
|
South Korea
|
||||
| 1970-1990 |
8.93
|
3.43
|
3.43
|
2.07
|
| 1990-2007 |
5.60
|
2.72
|
0.99
|
1.89
|
| 2007-2011 |
3.07
|
1.42
|
0.15
|
1.51
|
SOURCE: Penn World Table 8.0.
NOTE: The human capital variable used to adjust labor is from the Penn World Table and is a function of average years of schooling in a country.
Total output grew rapidly in Japan from 1970 to 1990, on average 4.5 percent a year. In the same interval, the output growth due to capital accumulation was 2.4 percent a year, accounting for more than 50 percent of the output growth. On the other hand, the contribution of labor growth was much smaller, 0.73 percent, or about 20 percent of the total growth in output. The remaining 30 percent of the total growth in total output is attributed to the growth in TFP, which grew at a yearly rate of 1.4 percent during this period.
The middle row in the top panel of the table shows the same exercise for the period 1990-2007. Looking at the factors' growth, the drop in the output growth is not surprising. The growth rates in capital, labor and TFP were all smaller than in the earlier period. However, the extent of output growth that capital accounts for increased, suggesting that this factor was not the primary explanation for the slowdown in growth. Strikingly, the change in the labor input of production is now slightly negative; this shows a potential direction to look at in assessing the slowdown in the Japanese economy.
Discontinued increase in labor force participation, diminishing returns in higher education and decreasing hours all may have contributed to the slowdown of the Japanese economy during this period. We can also see from the middle row that TFP growth slowed down substantially, too. There may be different explanations for this observation. Perhaps, Japanese corporations lost their edge in innovation, or the institutions affecting the allocation of resources (e.g., government and the financial sector) may be doing a worse job of allocating the resources to the best producers. In fact, in their 2008 work, economists Ricardo J. Caballero, Takeo Hoshi and Anil K. Kashyap argued that the continued lending by the Japanese financial sector to the otherwise insolvent, inefficient firms kept the Japanese market congested, affected the profitability of more-efficient firms and prevented the economy from reaching the optimal level of firm entry and exit.
Qualitatively, the changes from the 1990-2007 interval to the 2007-2011 interval are in the same direction with the changes from the 1970-1990 interval to the 1990-2007 interval. Capital, labor and TFP all have growth rates lower than before, making the output growth for 2007-2011 negative.
The U.S. Experience
One could argue that what happened in Japan is natural for a rich, mature economy. If that is the case, we should expect that the U.S. would experience a similar slowdown—and it has, but only to some extent. The experience of Japan may be useful to understanding the slow recovery of the U.S. after the financial crisis. To evaluate that hypothesis, the same exercise that was performed for Japan was undertaken for the U.S., as well as for South Korea.
We found that the performance of labor in Japan was a more-extreme version of what happened in the U.S. and South Korea. From the 1970-1990 interval to the 1990-2007 interval, growth in labor input decreased, both in the U.S. and in South Korea, though changes were milder than in Japan. This suggests that economies might grow less as they develop because the growth of labor slows down.
In terms of the contribution of TFP, changes in Japan from the 1970-1990 interval to the 1990-2007 interval were more distinct from the ones observed in the U.S. and South Korea. For the U.S., TFP growth increased between the two intervals and the contribution of TFP to output growth increased much faster than in Japan. In South Korea, the growth rate in the later interval was very similar to the growth rate in the earlier one, suggesting that TFP was not a cause for the slowdown in output growth.
Why was the decline in the growth rate of labor much more dramatic in Japan than in the U.S. and South Korea? Why did TFP growth slow down in Japan, in a fashion not seen in the other two countries? An analysis of the contemporaneous issues of Japan might help to answer these questions.
Headwinds
Japan is facing headwinds that are arguably relevant, if not causes, for the slowdown in its economy. The three challenges that have received the most attention are the aging population, low inflation and growing public debt.
The aging of the population is strongly connected to the stagnant labor input illustrated in the table. Japan has the highest life expectancy among countries in the Organization for Economic Cooperation and Development—and Japan's population is aging rapidly. Since 1990, the ratio of the population that is older than the working age (i.e., older than 64) to that of the working age (i.e., between 15 and 64) has increased at an annual rate of about 4 percent. In 2012, this ratio reached an astonishing 39 percent. In comparison, the ratio in the U.S. was 20 percent, and the ratio in South Korea was 16 percent. The aging population not only puts a dent in the labor force, but it also affects the hours worked by the working-age population, which must spend time taking care of the elderly. If this trend continues, the labor contribution to the growth of output will continue to be negative in the future.
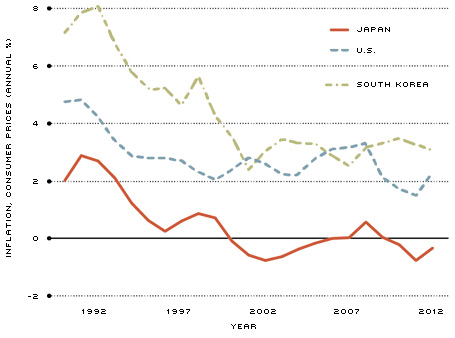
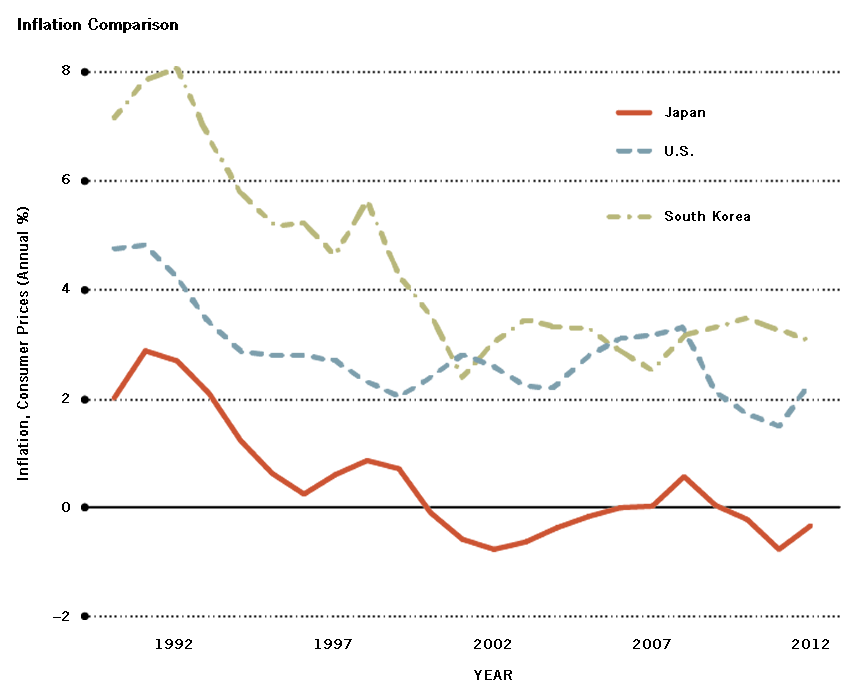
The second potential problem is low inflation (and deflation). Figure 2 shows inflation in Japan, the U.S. and South Korea, measured as the average annual percentage change in the consumer price index for the last three years. Notice that the fall in inflation coincides with the slowdown in the output documented above. Inflation in Japan was about 3 percent in the beginning of the 1990s and fell to negative values by the end of the decade; it has never really recovered. The U.S. and South Korea also saw inflation fall until the early 2000s; however, the decline was substantially worse in Japan.
The most prevalent argument against deflation is that it induces households to hold cash, dampening consumption. Another argument is that deflation is the consequence of strong demand for the Japanese currency. This strong demand appreciates the Japanese exchange rate, and exporters lose their competitive edge in the international market. This may lead to less innovation, which in turn would affect TFP growth.
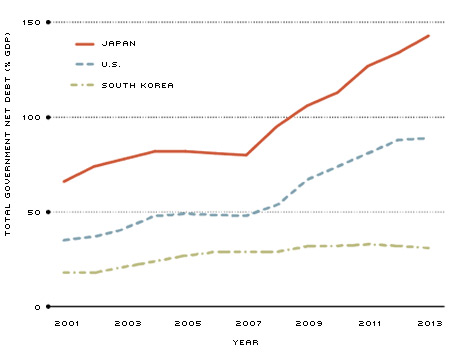
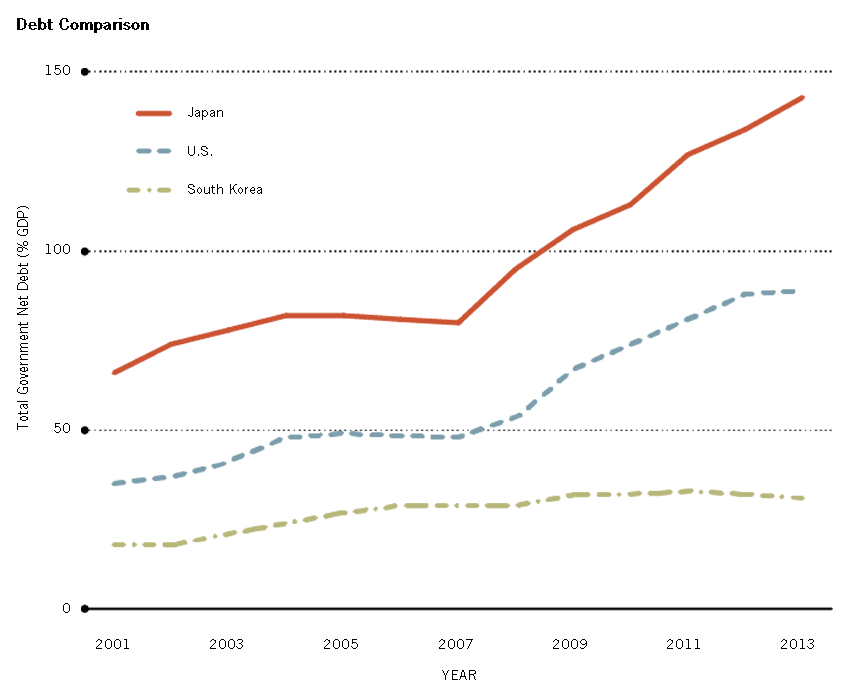
Finally, Japan has a very high public debt relative to GDP. Figure 3 shows the total government net debt of Japan, the U.S. and South Korea relative to GDP.[4] In Japan, the ratio surpassed 140 percent by 2013 after an annual growth rate of more than 6.4 percent since 2001. These levels of debt together with deflation put even more pressure on the government as the amount to be repaid grows even more in real terms.
"Abenomics"
In order to mitigate the ongoing low inflation, boost economic growth and reduce the public debt, Japanese Prime Minister Shinzo Abe launched a comprehensive package of initiatives in 2012. The first initiative is aimed at monetary easing, with the goal of increasing inflation to 2 percent. As part of this effort, the Bank of Japan pledged to increase the monetary base. In a speech last October in New York, the governor of the Bank of Japan, Haruhiko Kuroda, said that the monetary base in Japan would double in two years to the equivalent of $2.78 trillion—56 percent of nominal GDP. (For the U.S., the corresponding rate is about 20 percent.)[5]
The second initiative involves fiscal stimulus. The government is planning on spending more money on the infrastructure of the economy not only to help future economic growth but to create short-run domestic demand for Japanese firms. Since these policies will increase an already high public debt, the government is starting, among other things, to increase the consumption tax.
The final initiative of the so-called Abenomics pertains to structural reforms. The plan includes the deregulation of several industries. Measures will be taken to increase the labor force participation rate of the younger portion of the population. Trade partnerships within the region will be improved.
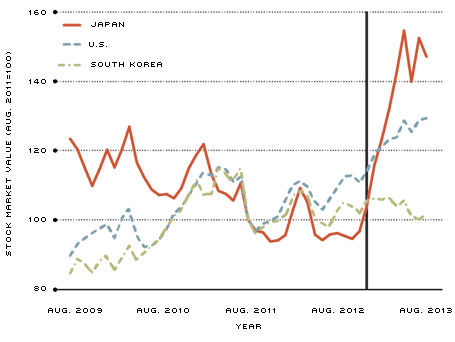
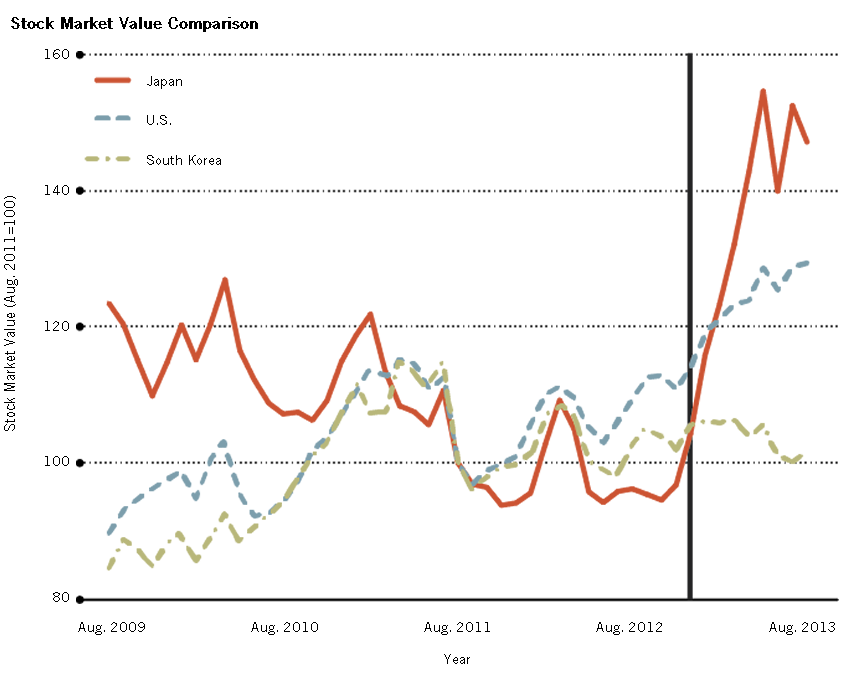
While fiscal stimulus and structural reforms are likely to take several years to produce an impact, we can already analyze the effects of the first initiative, monetary easing, by looking at the evolution of nominal variables in Japan. Using monthly data, we focused on three indicators. First, we looked at the total value of shares of publicly traded corporations in Japan. An increase in this indicator for Japan on the heels of the announcement of the new set of policies would signal a positive response in the market to Abenomics. That's exactly what happened, as shown in Figure 4. The vertical line in this figure (and in Figures 5 and 6) corresponds with the December 2012 announcement of the prime minister's initiatives. Figure 4 shows that after late 2012, the value of shares increased by a large percentage, with a slope much larger than in the U.S. and South Korea. Such an increase in the share prices can be attributed to exchange rate depreciation,[6] or just to better forecasts on profits.
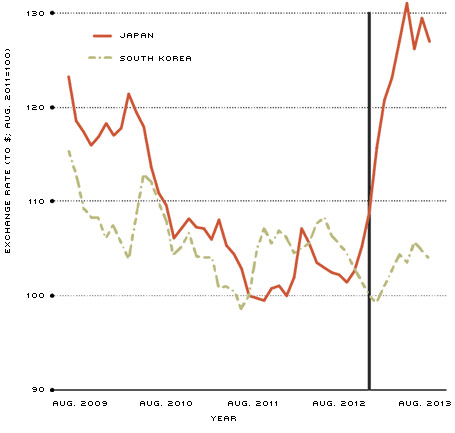
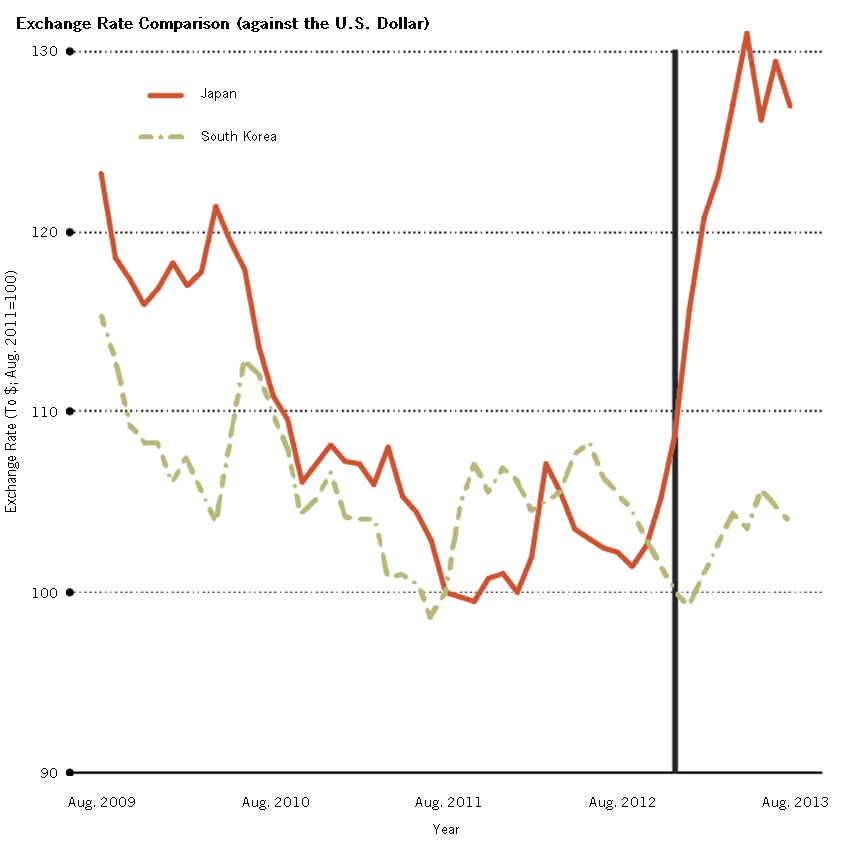
Another way of measuring the impact of Abe's policies is to look at the exchange rate, showing the value of one U.S. dollar in terms of the Japanese yen in recent years. A weaker yen relative to the dollar after the introduction of the prime minister's new policies would raise the exchange rate from 2013 on. Figure 5 shows the exchange rate for Japan and compares it with South Korea's exchange rate with the dollar. The value of the yen relative to the dollar decreased sharply in the post-Abenomics period.
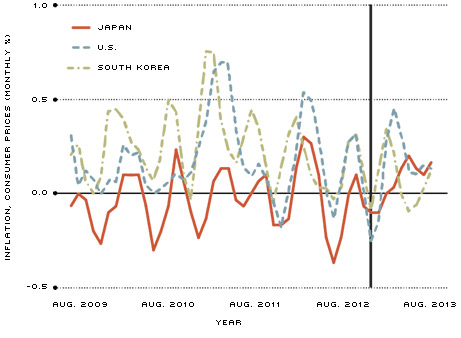
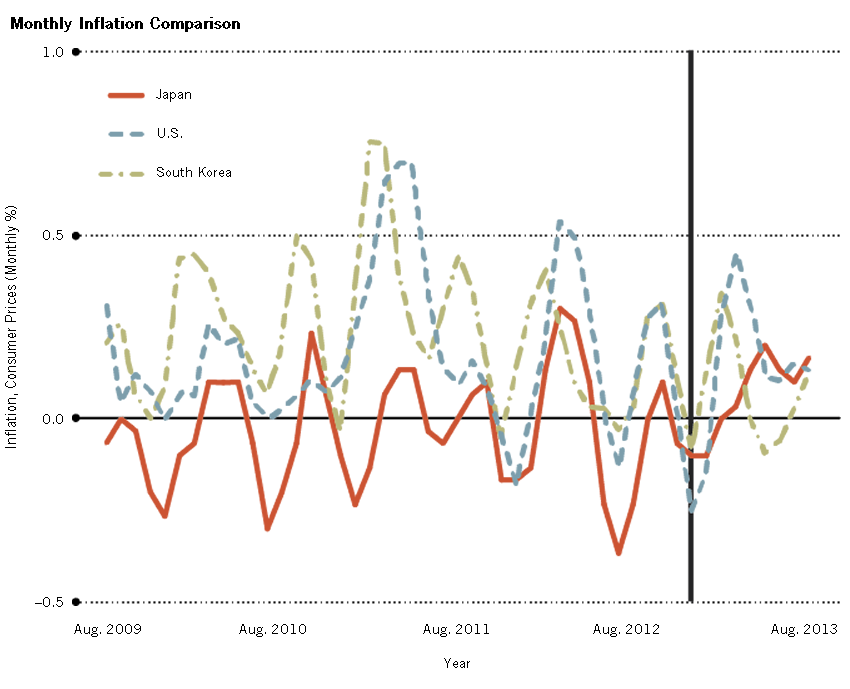
Did inflation increase? Figure 6 shows the monthly inflation pattern, measured as the average percentage increase in consumer prices for the last three months. Although the changes are very small, notice that monthly inflation started increasing after December 2012 and kept increasing even as the U.S. and South Korea experienced decreasing inflation.
In the short run, Abenomics is showing certain success with changing the course of nominal variables. To what extent the new policies will help the Japanese economy overcome more-structural and longer-term issues—such as the shrinking labor force and low growth of productivity—remains to be seen.
Japan's long-lasting issues with low inflation and low growth, and its recent attempts to overcome them, certainly provide an invaluable experiment for the U.S. economy. However, this article shows that during the past 20 years these two economies have had very different demographic trends that affected economic growth. Hence, the Japanese experience should be approached with caution for guiding U.S. policy.
Stock Market Value Comparison
SOURCE: Organization for Economic Cooperation and Development's Main Economic Indicators.
NOTE: The vertical rule marks the December 2012 announcement by the Japanese prime minister of major initiatives to improve the economy.
Exchange Rate Comparison (against the U.S. Dollar)
SOURCE: Board of Governors of the Federal Reserve System.
NOTE: The vertical rule marks the December 2012 announcement by the Japanese prime minister of major initiatives to improve the economy.
Monthly Inflation Comparison
SOURCE: OECD's Main Economic Indicators.
NOTES: Inflation rates are the averages of the last three observations. The vertical rule marks the December 2012 announcement by the Japanese prime minister of major initiatives to improve the economy.
Endnotes
- For instance, in his 2010 paper, James Bullard, president of the Federal Reserve Bank of St. Louis, considered Japan's experiences as a potential scenario for the U.S. [back to text]
- The reason for studying 2007-2011 separately is to isolate the potential effects of the financial crisis, which started in 2007. [back to text]
- See Hayashi and Prescott, and Kobayashi for similar exercises. [back to text]
- To get the net debt, debt instruments such as monetary gold and SDRs (special drawing rights), currency and deposits, debt securities, loans, insurance, pensions, standardized guarantee schemes, and other accounts receivables are subtracted from the gross amount. [back to text]
- See Kuroda. [back to text]
- For instance, firms that make transactions mostly in U.S. dollars may see their (yen-denominated) share prices increase even if the profits (in terms of the U.S. dollars) are not expected to change. [back to text]
- For the Penn World Table, see Feenstra, Inklaar and Timmer. [back to text]
References
Bullard, James. "Seven Faces of the Peril." Federal Reserve Bank of St. Louis Review, September/October 2010, Vol. 92, No. 5, pp. 339-52. See http://research.stlouisfed.org/publications/review/10/09/Bullard.pdf.
Caballero, Ricardo J.; Hoshi, Takeo; and Kashyap, Anil K. "Zombie Lending and Depressed Restructuring in Japan." American Economic Review, December 2008, Vol. 98, No. 5, pp. 1,943-77.
Hayashi, Fumio; and Prescott, Edward C. "The 1990s in Japan: A Lost Decade." Review of Economic Dynamics, January 2002, Vol. 5, No. 1, pp. 206-35.
Feenstra, Robert C.; Inklaar, Robert; and Timmer, Marcel P. "The Next Generation of the Penn World Table," Working Paper No. 19255, National Bureau of Economic Research, 2013. See www.ggdc.net/pwt.
Kobayashi, Keiichiro. "Payment Uncertainty, the Division of Labor, and Productivity Declines in Great Depressions." Review of Economic Dynamics, October 2006, Vol. 9, No. 4, pp. 715-41.
Kuroda, Haruhiko. "Overcoming Deflation—the Bank of Japan's Challenge." Speech at the Council on Foreign Relations, New York, N.Y., Oct. 10, 2013. See www.bis.org/review/r131016c.pdf.

Views expressed in Regional Economist are not necessarily those of the St. Louis Fed or Federal Reserve System.
For the latest insights from our economists and other St. Louis Fed experts, visit On the Economy and subscribe.
Email Us