


Are District Banks Losing Their Profit Edge?
Last year proved to be another banner year for U.S. banks as earnings topped $52.1 billion—an increase of 7.1 percent over 1995. Indeed, for all U.S. banks, return on average assets (ROA), which is a common tool for assessing bank profitability, finished the year at 1.25 percent—the highest figure in more than 25 years. Eighth District banks shared in the good fortune, also posting a record average ROA in 1996.1
Although both groups of banks have enjoyed record profits in recent years, U.S. banks have performed relatively better. As a result, they are now recording higher average ROA figures than District banks, reversing a decades-long trend. At year-end 1992, for example, District banks reported an average ROA of 1.13 percent, while U.S. peer banks—commercial banks holding less than $15 billion in average assets—posted an average ROA of 1.05 percent.2 Four years later, peer banks recorded an average ROA of 1.35 percent, compared with the District average of 1.33 percent. A careful look at the data reveals that overhead expense, in general, and personnel expense, in particular, is the reason for the reversal in the longstanding relationship between peer and District bank ROA.
Breaking Down ROA
To understand the trends in ROA, it is first necessary to look at the measure's three major components: net interest income as a percentage of average earning assets, also known as the net interest margin or margin; net noninterest expense as a percentage of average assets; and the loan and lease loss provision as a percentage of average assets.
The margin—the most important determinant of ROA—is the difference between interest income and interest expense, divided by average earning assets. The margin gauges how well a bank performs the bread-and-butter functions of taking deposits and making loans. Interest income changes over time with fluctuations in loan and security yields and the mix of loans and securities in the earning asset portfolio. Movements in interest expense, meanwhile, reflect changes in deposit and other rates that banks pay on liabilities and the mix of interest- and noninterest bearing deposits.
The net noninterest expense ratio, which is noninterest expense minus noninterest income, divided by average assets, is the second major determinant of bank profitability.3 Noninterest expense includes overhead costs, such as personnel and occupancy expenses.4 Noninterest income consists mostly of service charges, trust income, income from the sale of mutual funds and annuities, and fees for off-balance sheet services.5
Each quarter, banks also set aside earnings for anticipated loan losses. This amount—the loan and lease loss provision (LLP)—is an expense directly charged against profits and is the final major component of ROA. In recent years, the LLP has had little effect on overall profits. In December 1996, for example, the District's aggregate LLP expense came to only 0.25 percent of average assets.6 In contrast, the margin was 4.47 percent, and net noninterest expense was 1.76 percent of average assets.7
ROA Role Reversal
District banks have historically posted higher average ROA figures than U.S. peer banks. Over the last 10 years, for example, peer bank ROA averaged 0.95 percent; at District banks the average was 1.07 percent. According to year-end data from 1992—a representative year before the reversal in peer bank and District bank ROA—the average margin for peer banks was 41 basis points higher than the District average—a huge gap. District banks still recorded higher average ROA because they had a lower net noninterest expense ratio (by 17 basis points) and LLP ratio (by 29 basis points)—differences that more than compensated for the lower margin.
As the accompanying chart shows, the historical relationship between U.S. peer and District bank ROA reversed in 1993. Between 1992 and 1996, peer bank ROA improved 30 basis points to 1.35 percent, while District banks' ROA increased only 20 basis points to 1.33 percent. The 8 basis-point advantage District banks enjoyed in 1992 has dissolved into a 2 basis-point deficit.
Trading Places
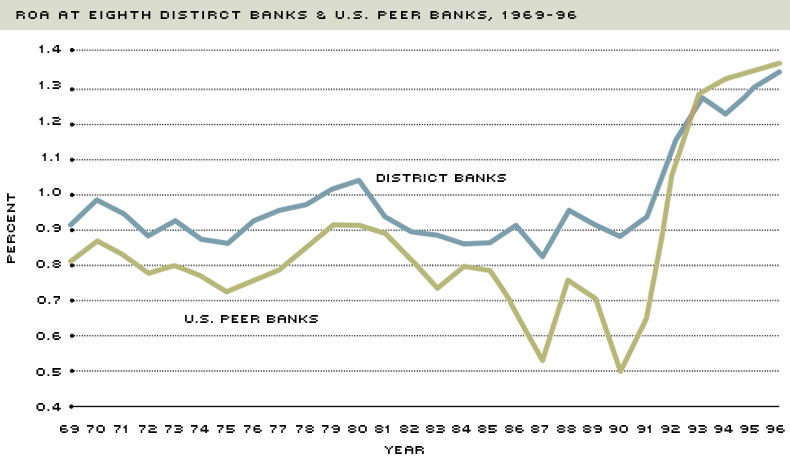
NOTE: Return on Average Assets (ROA) equals net income divided by average assets. U.S. peer banks consist of all U.S. commercial banks with average assets of less than $15 billion.
SOURCE: FFIEC Reports of Condition and Income for all Insured U.S. Commercial Banks, 1969-96
A shrinking gap between District and peer bank net noninterest expense explains this swing in ROA. At year-end 1992, District banks posted a net noninterest expense ratio that was 17 basis points below that of peer banks. By December 1996, the gap was only 2 basis points. Changes in overhead expense—rather than noninterest income—were responsible for this shrinking gap. Between 1992 and 1996, peer banks cut noninterest expense from 3.95 percent to 3.83 percent of average assets, while District banks saw overhead rise from 3.19 percent to 3.29 percent of average assets.
Relative fluctuations in noninterest expense reflect changes in personnel and occupancy expenses.8 Since 1992, peer banks have reduced personnel expense from 1.58 percent to 1.55 percent of average assets; over the same period, District banks saw personnel expense jump from 1.47 percent to 1.53 percent of average assets. Peer banks also trimmed occupancy expense from 0.49 percent of average assets in 1992 to 0.46 percent in 1996, while occupancy expense at District banks remained unchanged at 0.40 percent of average assets.
Available data suggest several possible explanations for the distinct differences in personnel and occupancy expense trends at U.S. peer and District banks. Robust economic conditions in the Midwest, coupled with an increasing urbanization of banking activity, are the likely cause of the difference in personnel expense trends. The trend in occupancy expense, however, appears to reflect relatively faster consolidation at peer banks.
The robustness of regional economic conditions can be seen in the low unemployment rates in District metropolitan statistical areas (MSAs), which signal tight labor markets and upward pressure on wages, including wages for bank jobs. In 1996, the average unemployment rates for the four largest District MSAs were well below the national rate of 5.4 percent, with Little Rock at 3.6 percent, Louisville at 4.0 percent, Memphis at 4.2 percent, and St. Louis at 4.2 percent.
Wages at District banks have indeed risen faster than the national average. Between 1992 and 1996, average wages and benefits at District institutions rose from $29,177 to $35,449, a 21.5 percent increase. Average wages and benefits at peer banks, meanwhile, grew 14.4 percent—from $33,039 to $37,787—over the same period.
Higher personnel costs could also reflect a shift in banking activity from rural to urban areas in the District. In December 1992, for example, 56.2 percent of District bank employees worked for institutions headquartered in MSAs. By December 1996, that portion had increased to 58.8 percent. During the same period, the percentage of U.S. peer bank employees working in institutions headquartered in MSAs fell slightly. This shift in banking activity could explain part of the rise in District personnel expense since wage and benefit costs tend to be higher in urban areas than in rural regions.
The ongoing consolidation in U.S. banking probably explains relative movements in occupancy expense. Throughout the country, banks are merging and closing redundant offices to realize cost savings. As evidence, the number of U.S. peer banks tumbled from 11,290 to 9,402 between December 1992 and December 1996, a 16.7 percent decline. At the same time, the number of District banks fell from 1,194 to 1,036—a 13.2 percent drop. The faster pace of consolidation outside the Eighth District suggests that peer banks have been able to close more brick and mortar offices and, hence, trim occupancy expense by a greater amount than District banks.
A Temporary or Sea Change?
Over the last four years, District banks have seen their historical advantage in profitability slip away because of unfavorable trends in noninterest expense. The strength of the Midwestern economy, the increasingly urban flavor of District banking, and the faster pace of consolidation outside the District all suggest that these unfavorable trends are likely to continue, at least in the short run. If so, the traditional relationship between peer bank and District bank ROA may not re-emerge for some time.
Endnotes
- Data are taken from the Federal Financial Institutions Examination Council quarterly reports of condition and income for all insured U.S. commercial banks. ROA is defined as net income divided by average assets. [back to text]
- The Eighth District has no banks with more than $15 billion in average assets. Therefore, the peer group is U.S. banks with less than $15 billion in average assets. [back to text]
- Because noninterest expense always exceeds noninterest income, it is expressed as net noninterest expense. [back to text]
- Noninterest expense also contains a catch-all category, "other" noninterest expense, which includes losses on loan sales and seized collateral, FDIC deposit insurance premiums and fees paid to directors. [back to text]
- Off-balance sheet services are services that do not explicitly appear on the balance sheet, such as issuing standby letters of credit, back-up lines of credit and loan commitments. [back to text]
- The LLP can play a major role in determining ROA. In 1987, for example, large regional and money center banks made huge LLPs to cover anticipated losses on loans to lesser developed countries. As a result, the average ROA for all U.S. banks plummeted from 0.62 percent in 1986 to 0.09 percent in 1987. [back to text]
- The denominator for the net interest margin is average earning assets, rather than average assets. Net interest income as a percentage of average assets was 4.11 percent in December 1996. [back to text]
- Available data are not sufficiently detailed to allow analysis of "other" noninterest expense. [back to text]

Views expressed in Regional Economist are not necessarily those of the St. Louis Fed or Federal Reserve System.
For the latest insights from our economists and other St. Louis Fed experts, visit On the Economy and subscribe.
Email Us