The U.S. Financial Landscape on the Eve of the Pandemic
KEY TAKEAWAYS
- The Fed’s current intervention, while unprecedented in size and scope, bears strong similarities to the way it responded to the 2007-08 financial crisis.
- The composition of financial assets held by different sectors remained largely unchanged between 2007 and 2019, with some notable exceptions.
- Though the financial sector as a whole moved toward increased liquidity and safety, the current pandemic revealed that important fragilities remain.

The measures undertaken to combat the COVID-19 pandemic have led to an unprecedented U.S. economic contraction. The severity of this crisis has been compounded by the high uncertainty surrounding health, economic and policy outcomes.
Early on, the Federal Reserve stepped in to keep financial markets functioning properly and prevent a possible panic. As a result, the Fed’s balance sheet has increased by almost $3 trillion since the end of February. This intervention, while unprecedented in size and scope, bears strong similarities to the way the Fed responded to the financial crisis of 2007-08.
This article looks at the financial state of the U.S. economy at the onset of the pandemic and draws a comparison with how it was positioned before the financial crisis of 2007-08. Changes in the intervening period may provide some insight into how the economy and policymakers have reacted in the current episode.
In the years following the financial crisis, liquidity was abundant and interest rates remained low; the financial sector underwent a significant regulatory overhaul and was subjected to even closer monitoring and supervision. Yet, the overall financial structure of the U.S. changed remarkably little from 2007 to 2019.
For my analysis, I focused on the financial asset composition of three main private actors: households and nonfinancial businesses, financial institutions, and foreign investors.Note that I am excluding the public sector from the analysis. Total financial assets held by all levels of government and the Federal Reserve banks are small relative to those held by the other sectors. Figures further in the article show the asset composition of these three sectors for 2007 and 2019, expressed in 2019 dollars.Data are from the Flow of Funds and refer to end-of-period.
I then grouped financial assets into six categories:
- The first category is “cash, reserves and deposits,” which includes cash holdings; bank reserves; checking, savings and time deposits; and money market fund shares, as well as other liquid and short-term assets (e.g., repurchase agreements). This group includes the safest and most liquid assets in the economy. (Reserves are relevant to only the domestic private financial sector.)
- The second category is “Treasuries and agency- and GSE-backed securities”. These are safe, liquid securities issued or backed by the federal government.
- The third asset category is “other securities and mutual funds shares,” which consists of holdings of all other debt securities, mostly corporate and municipal bonds, plus mutual funds shares; it excludes money market funds, which are included in the first category.
- The fourth category is “loans” (mortgages, consumer credit, advances, etc.).
- The fifth category is “equities and foreign direct investment,” which includes corporate and noncorporate equity holdings, plus foreign direct investment. (Noncorporate equities are relevant to only the domestic private nonfinancial sector, and foreign direct investment is relevant to only the foreign sector.)
- The sixth category is “other assets,” which groups the remaining asset holdings.
The Domestic Private Nonfinancial Sector
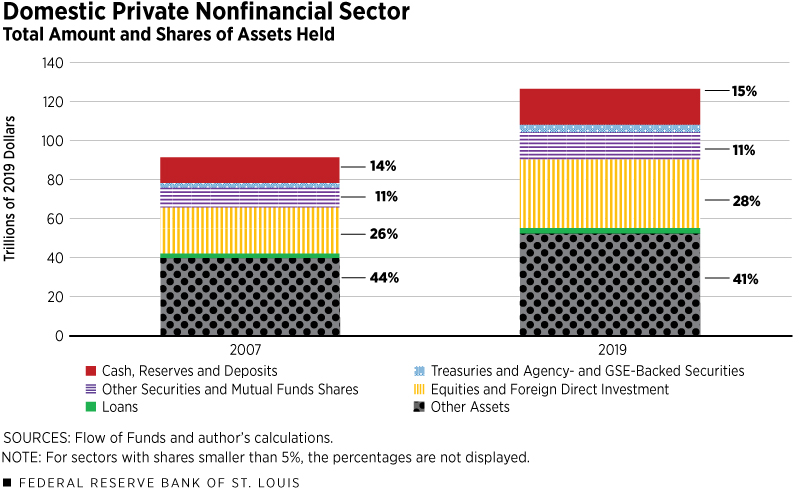
The domestic private nonfinancial sector is composed of households, nonprofits and nonfinancial businesses. It is the biggest of the three sectors analyzed here. As of December 2019, total financial assets reached $127 trillion, six times the U.S. gross domestic product (GDP). Assets grew by 39% between 2007 and 2019 in real terms, far exceeding the growth of real GDP over the same period, about 22%.
Remarkably, when grouping asset holdings in the six main categories described above, little changed during those 12 years, as seen in Figure 1.
Less than 20% of the assets held by the domestic nonfinancial sector were in the form of safe liquid assets (i.e., cash, deposits, Treasuries and agency- and GSE-backed securities). Most financial assets held by this sector are in the form of equities, mutual funds and pension entitlements.Pension entitlements account for about half of the category “other assets.” They do not include Social Security.
The Domestic Private Financial Sector
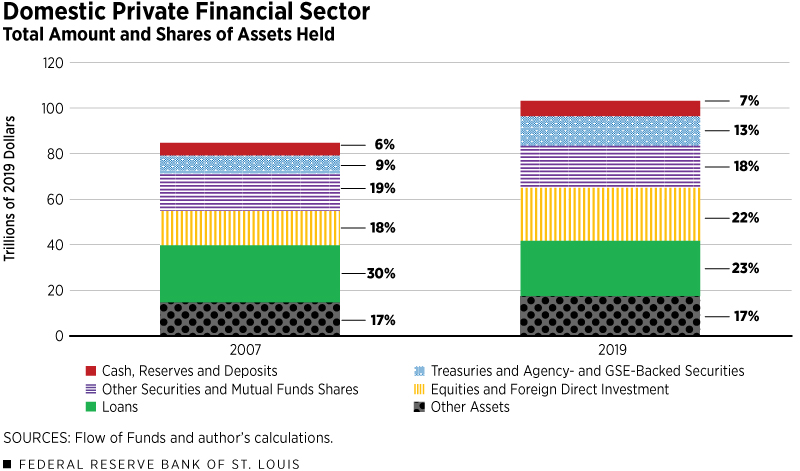
The domestic private financial sector includes private depository institutions, insurance companies, private and public pension funds, mutual funds, GSEs and various other financial entities. Note that it excludes the Federal Reserve banks. This sector is slightly smaller than the nonfinancial sector, holding $104 trillion in assets, as of December 2019. Between 2007 and 2019, it grew at the same pace as GDP.
In this case, we observe a shift toward safer and more liquid assets, as seen in Figure 2.
The combined holdings of cash, reserves, deposits, Treasuries and agency- and GSE-backed securities increased from 16% to 19% of total financial assets between 2007 and 2019.These numbers do not exactly match Figure 2 because of rounding. This increase was accompanied by a rise in corporate equity holdings, from 18% to 22% of total assets. These increases occurred at the expense of a relative contraction in loans, which went from 30% to 23% of total financial assets.
This shift in risk is common during and immediately after recessions, but it persisted long after the last recession ended. We can attribute the different behavior this time to the changes in policy and financial regulation in response to the financial crisis. These effects are tangible, if not overly dramatic, favoring liquidity and safety.
The Foreign Sector
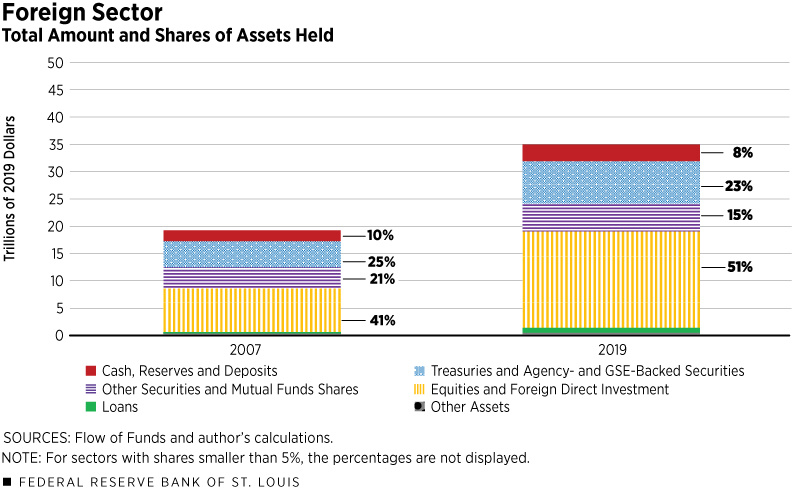
The holdings of U.S. financial assets by nonresidents increased dramatically between 2007 and 2019: about 82% in real terms, reaching $35 trillion, as seen in Figure 3.
This growth was mostly due to increases in the holdings of Treasuries, corporate equities and direct investment. Arguably, the increase in foreign investments in the U.S. was due to its safety, relative to the rest of the world. This “flight to safety” benefited both the government and private sectors: As of December 2019, foreign residents held 40% of the federal debt in the hands of the public and close to one-fifth of corporate equities.“Debt held by the public” excludes holdings by federal agencies (such as Social Security trust funds) but includes holdings by Federal Reserve banks.
Conclusions
The aftermath of the financial crisis and recession witnessed a larger Fed footprint and increased financial regulation and oversight. During that time, the Fed maintained a large balance sheet and kept its policy rate at historically low levels. Banks, bank holding companies and systemically important financial institutions are now subjected to close monitoring and supervision. Banks, in particular, have been forced by new regulations to keep large quantities of liquid assets.Examples of new regulations include the liquidity coverage ratio (LCR) and resolution planning. Most of these changes were introduced by the Dodd-Frank Wall Street Reform and Consumer Protection Act of 2010. All these changes (plus others) reshaped financial activity in the U.S. prior to the pandemic.
And yet, when viewing the financial landscape broadly, it is remarkable how little has changed. With some notable exceptions, the composition of financial asset holdings in different sectors of the economy remained largely unchanged between 2007 and 2019.
There were, however, some important changes. First, the financial sector became more liquid and safe. This is not surprising given the push of new laws and regulations. Second, there was a significant increase in foreign investment, which benefited both the government and private sectors. Despite low interest rates, the relative safety of U.S. assets resulted in increased foreign holdings of Treasury debt, corporate equities and direct investment.
The safety and liquidity of financial markets were tested during the early days of the COVID-19 pandemic. At the retail level, the payment and credit systems operated normally. As during the financial crisis of 2007-08, there were no widespread runs on commercial banks.
But just as it was during the financial crisis, the reality at the institutional and corporate levels was quite different. For example, institutional investors built up reserves, which put great stress on money market funds and commercial paper markets; highly leveraged financial firms received margin calls, which forced them to sell liquid assets; and corporate debt yields increased sharply.
Early Fed intervention, in the form of lower rates and the opening of various credit facilities, may have prevented this stress from developing into a wholesale panic. Still, the experience highlighted the fact that, despite the lessons learned from the previous crisis and the actions taken to address them, the nonbank financial sector continues to exhibit areas of fragility.
Endnotes
- Note that I am excluding the public sector from the analysis. Total financial assets held by all levels of government and the Federal Reserve banks are small relative to those held by the other sectors.
- Data are from the Flow of Funds and refer to end-of-period.
- Pension entitlements account for about half of the category “other assets.” They do not include Social Security.
- These numbers do not exactly match Figure 2 because of rounding.
- “Debt held by the public” excludes holdings by federal agencies (such as Social Security trust funds) but includes holdings by Federal Reserve banks.
- Examples of new regulations include the liquidity coverage ratio (LCR) and resolution planning. Most of these changes were introduced by the Dodd-Frank Wall Street Reform and Consumer Protection Act of 2010.
Views expressed in Regional Economist are not necessarily those of the St. Louis Fed or Federal Reserve System.
For the latest insights from our economists and other St. Louis Fed experts, visit On the Economy and subscribe.
Email Us


