Rising Rates Impact Borrowing Costs for the U.S. Government, Too
KEY TAKEAWAYS
- As the Fed raises short-term interest rates, the cost of borrowing increases for everyone, including the U.S. government.
- A hike in the Fed’s policy rate will directly impact rates on short-term Treasuries, but the effect on long-term Treasuries is less predictable.
- Interest rates on longer-term Treasuries are also shaped by macroeconomic expectations and other factors.

As the U.S. economy continues to grow, the Federal Reserve remains on its path to normalize monetary policy. An important part of this normalization process is the gradual increase of the policy rate—that is, the federal funds rate target.The Federal Open Market Committee, the Fed’s primary monetary policymaking body, sets a range for the federal funds rate, the interest rate at which depository institutions lend balances at the Federal Reserve to other depository institutions overnight. On June 14, the policy rate was set at 1.75 to 2.00 percent. As the policy rate rises, so do other interest rates in the economy, and thus the cost of borrowing rises for everyone, including the federal government.
This article explores the relationship between the federal funds rate and the U.S. government’s cost of borrowing. The two are related, but not in a trivial way. While the Federal Reserve’s policy rate directly affects short-term interest rates, the government borrows at many different maturities, ranging from one month to 30 years. The Treasury pays a different interest rate at each maturity, and these rates are not equal to (but are influenced by) the federal funds rate.
The government’s cost of borrowing is likely to become an increasingly important issue. The federal debt stands at its highest level since the 1940s, having exceeded 103 percent of annual gross domestic product (GDP) at the end of 2017.See https://fred.stlouisfed.org/series/GFDEGDQ188S.
What Determines the Government’s Borrowing Cost?
One can think of interest expenses for the federal government as the product of both the interest rate and the total stock of federal debt. All else constant, these expenses tend to increase when the stock of federal debt is higher or when the Federal Reserve raises interest rates.
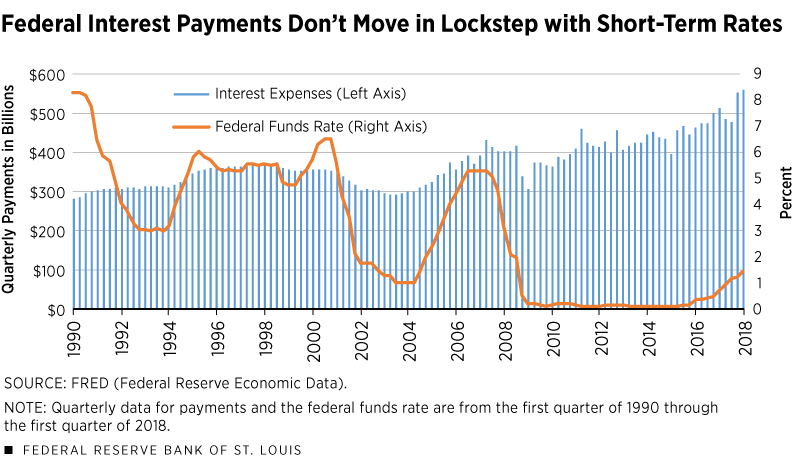
Figure 1 shows quarterly interest payments by the federal government and the path of the federal funds rate since 1990. The effects of movements in the interest rate are visible during periods of rapid rate increases or decreases: In 2004, for example, the Federal Reserve started raising interest rates, and this led to a noticeable increase in interest payments.
The relationship is, however, nonlinear. First, as mentioned, the total stock of debt also matters. That is why interest payments rose after 2009, even though interest rates were roughly constant. Debt was rising during this period due to increased government spending on extraordinary stimulus programs (such as the American Recovery and Reinvestment Act) and interventions in the financial sector (such as the Troubled Asset Relief Program).
Additionally, as mentioned in the introduction, the Federal Reserve’s policy rate affects primarily short-term interest rates, but the Treasury borrows at many different maturities, paying a wide range of interest rates. Understanding the maturity structure of government debt is therefore important to understanding the behavior of government borrowing costs. These longer-term interest rates are influenced by the federal funds rate but are also affected by many other factors, as we will discuss next.
Short and Long Maturities
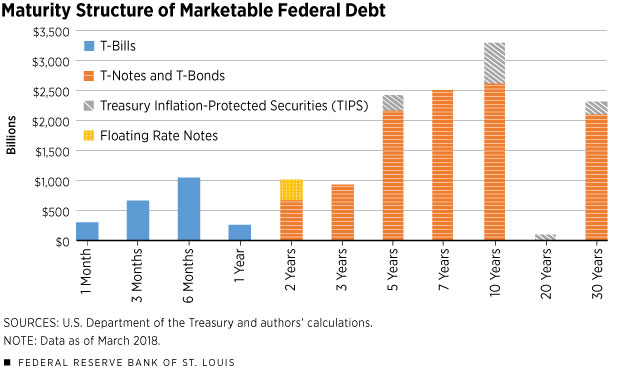
Figure 2 presents the maturity structure of marketable federal debt as of March 2018. Each bar corresponds to the value of outstanding debt issued at the given maturity.The plot corresponds to contractual maturities, i.e., the maturities at which each debt security was issued. Another important concept is residual maturity, which is the difference between the contractual maturity and the current date.
Figure 2 also decomposes this federal debt by the type of security. Each of these securities has different characteristics, such as a particular maturity schedule or a formula for its interest payments.
The bulk of this federal debt is financed using three main types of securities: Treasury bills, Treasury notes and Treasury bonds. These three types of securities account for almost 90 percent of all marketable federal debt outstanding as of March 2018.The composition of federal debt outstanding can be found in the Monthly Statement of the Public Debt of the United States, issued monthly by the Department of the Treasury. Other types of marketable debt securities are Treasury inflation-protected securities (TIPS) and floating rate notes. Marketable debt securities account for over 73% of total federal debt outstanding. The remainder, nonmarketable debt, is mostly accounted for by intragovernmental holdings and is ignored for the purposes of this article.
Treasury bills are typically issued at maturities of one month, three months, six months and one year. (The Treasury plans to offer two-month T-bills in October.) These securities do not pay any interest or coupon (they are known as zero-coupon bonds), and we can therefore measure their implied interest rate from the price at which the Treasury sells them: If the government sells at $99.50 a Treasury bill that promises a $100 payment in three months, we can think of this security as paying a fixed interest rate of close to 2 percent a year. Since these bonds have very short maturities, the implied interest rates will typically be close to the policy rate set by the Federal Reserve, less so as the maturity increases.
Treasury notes are issued at two-, three-, five-, seven- and 10-year maturities. These notes pay a fixed coupon twice a year, which is fixed at issuance.This coupon is roughly equal to the interest rate that ensures that the bond will be sold at par; that is, the Treasury sells the bond to an investor for the same amount of dollars that the bond pays at maturity.
Treasury bonds are identical to Treasury notes, but issued with a maturity of 30 years. When deciding to invest in these securities, as opposed to ones with shorter maturities, investors take into account the fact that they are locking their funds into an asset that pays a fixed interest rate for a long time horizon.
An alternative investment strategy could be to invest in short-term securities and continually roll over funds into new securities with the same maturity. In this case, if the Fed raises short-term rates, then the investor stands to earn a greater return. For this reason, among others, investors will typically demand a higher interest rate on these longer-term Treasury securities.
The Term Premium
This extra compensation that investors demand for holding long-term treasuries is known as the Treasury term premium, and it may not respond to movements in the policy rate in a predictable manner. The term premium can depend on expectations of future macroeconomic indicators—such as GDP growth, inflation and financial conditions—and even on other factors, such as demographics.
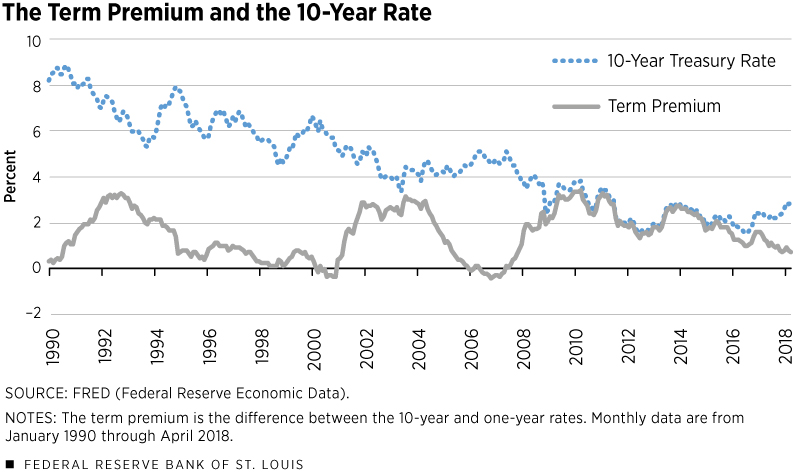
While long-term rates tend to move along with short-term rates, movements in the term premium are crucial to ascertain whether they will move by more or less. Figure 3 shows the behavior of the 10-year rate and of a common measure of the term premium—the difference between the 10- and one-year rates. The term premium fluctuates over the business cycle and is generally positive for the reasons explained above. From December 2008 to December 2015, the term premium coincided with the 10-year rate since short-term rates were at essentially zero.
Besides serving as a potential indicator of recessions,See, for example, the Dec. 1, 2017, speech by St. Louis Fed President James Bullard at www.stlouisfed.org/from-the-president/speeches-and-presentations/2017/assessing-yield-curve. the term premium also serves as an indicator of the relative cost of borrowing for the government across maturities. When the Treasury issues a long-term security, such as a Treasury note or bond, it fixes the coupon payment on that security and therefore protects itself against future increases in short-term interest rates by the Fed. The term premium is the cost of that insurance.This, obviously, also means that the Treasury will “miss out” on lower borrowing costs should the Federal Reserve lower its policy rate.
Conclusion
While rising interest rates are associated with higher borrowing costs for the federal government, the relationship is not linear. It depends not only on the current stock of debt but also on its composition, in particular the maturity structure.
While the cost of issuing short-term debt securities, such as Treasury bills, closely tracks the policy rate, this is not necessarily true for longer-term securities, such as notes or bonds, whose cost also depends on the term premium. This is especially relevant because longer-term securities (with a term over five years) represent over 70 percent of marketable federal debt outstanding.
Endnotes
- The Federal Open Market Committee, the Fed’s primary monetary policymaking body, sets a range for the federal funds rate, the interest rate at which depository institutions lend balances at the Federal Reserve to other depository institutions overnight. On June 14, the policy rate was set at 1.75 to 2.00 percent.
- See https://fred.stlouisfed.org/series/GFDEGDQ188S.
- The plot corresponds to contractual maturities, i.e., the maturities at which each debt security was issued. Another important concept is residual maturity, which is the difference between the contractual maturity and the current date.
- The composition of federal debt outstanding can be found in the Monthly Statement of the Public Debt of the United States, issued monthly by the Department of the Treasury. Other types of marketable debt securities are Treasury inflation-protected securities (TIPS) and floating rate notes. Marketable debt securities account for over 73 percent of total federal debt outstanding. The remainder, nonmarketable debt, is mostly accounted for by intragovernmental holdings and is ignored for the purposes of this article.
- This coupon is roughly equal to the interest rate that ensures that the bond will be sold at par; that is, the Treasury sells the bond to an investor for the same amount of dollars that the bond pays at maturity.
- See, for example, the Dec. 1, 2017, speech by St. Louis Fed President James Bullard at www.stlouisfed.org/from-the-president/speeches-and-presentations/2017/assessing-yield-curve.
- This, obviously, also means that the Treasury will “miss out” on lower borrowing costs should the Federal Reserve lower its policy rate.
Views expressed in Regional Economist are not necessarily those of the St. Louis Fed or Federal Reserve System.
For the latest insights from our economists and other St. Louis Fed experts, visit On the Economy and subscribe.
Email Us


