


Making Ends Meet on the Federal Budget Outlook and Challenges
With the advent of every new administration come numerous proposals to fix the federal budget, mostly involving tax code overhaul, entitlement reform and curbs on government debt. Invariably, these proposals get toned down during congressional review and often die before becoming a reality. With the various plans currently floating around, it seems like a good time to review the state and future of the federal government’s accounts.
Current Situation
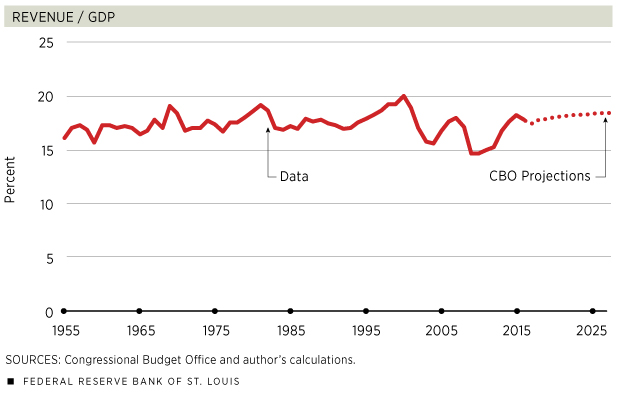
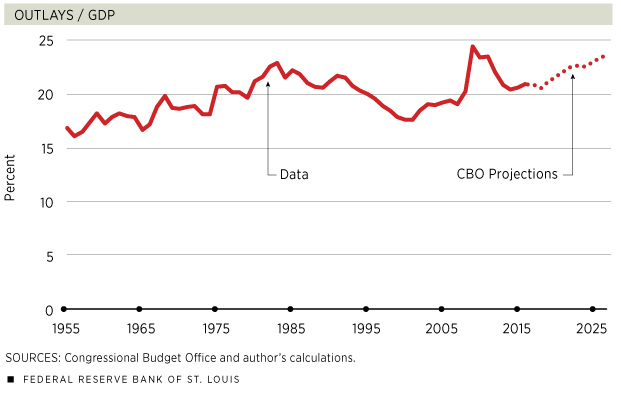
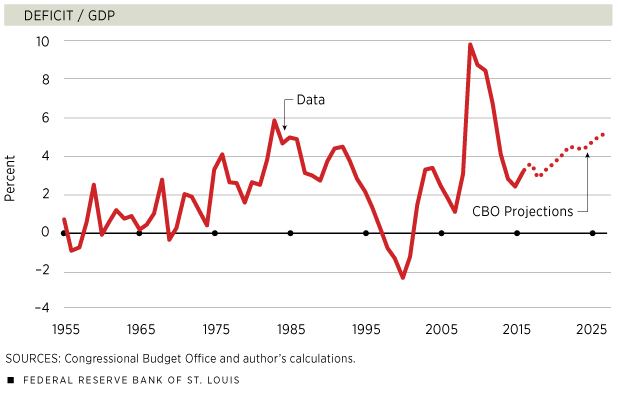
During the fiscal year 2016, the federal government spent almost $3.9 trillion, or 20.9 percent of gross domestic product (GDP).1 Revenues amounted to about $3.3 trillion, or 17.8 percent of GDP. The deficit was nearly $600 billion, or 3.2 percent of GDP, of which the interest on the debt accounts for about 41 percent. Current estimates by the Congressional Budget Office (CBO) project a similar outcome for 2017.
If we take the period from 1955 until the Great Recession (2007) as a reference, revenues are at normal levels, while expenditures are a bit high. On the upside, the government has benefited from prevailing low interest rates, which imply low interest payments on the debt.
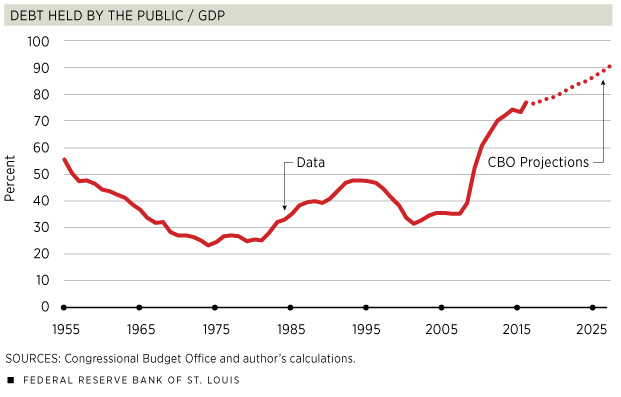
At the end of 2016, government debt held by the public was at 77.0 percent of GDP.2 If we exclude the holdings by Federal Reserve banks, this figure drops to 63.6 percent of GDP. However we measure it, debt is high: roughly twice the average percentage of GDP over 1955-2007.
The recent increase in the debt is the product of the government’s response to the financial crisis and subsequent recession; that response consisted of a combination of tax cuts and spending hikes. But, as mentioned above, while revenues returned to normal levels, spending remained elevated due to the permanent expansion of transfers to individuals, particularly major health care programs like Medicare and Medicaid. As the late American economist and Nobel laureate Milton Friedman once said, “Nothing is so permanent as a temporary government program.”3
A Closer Look at Spending and Revenues
Let us dig deeper into the federal government’s accounts. Roughly two-thirds of total expenditures correspond to mandatory outlays, i.e., spending required by existing law, other than appropriation acts. By far, the largest components in this category are Social Security and health care expenditures. Unemployment compensation, food stamps and student loans are examples of programs that also contribute to mandatory spending.
The role of mandatory spending became more prominent between the mid-1960s and mid-1970s, and then again starting with the most recent recession. In 2016, Social Security outlays were 4.9 percent of GDP, while major health care programs (net of offsetting receipts) totaled 5.5 percent of GDP.4 The combined impact of these two items has been increasing steadily over time.
In contrast, discretionary spending as a fraction of GDP has been declining steadily over time, mainly driven by a relative reduction in defense expenditures. Although U.S. defense expenditures remain by far the largest in the world, amounting to $585 billion in 2016, their burden in terms of output is actually small: about 3.2 percent of GDP. Interestingly, some developed countries (e.g., Italy and Portugal) spend more, as a fraction of GDP, on their debt interest than the U.S. pays on national defense.
On the revenue side, the biggest contributors are individual income and payroll taxes. Together, both of these sources amounted to 14.5 percent of GDP, accounting for a bit over 80 percent of total revenue in 2016. Perhaps surprisingly, corporate income taxes are a minor component in the government’s budget: 1.6 percent of GDP, or 9.2 percent of total revenue. This item used to be significantly more prominent before the 1980s. The causes of this decline are various and difficult to decompose precisely.5 It is important to note the relatively small contribution of corporate income taxes to government coffers given the various reform proposals floating around that often involve further contractions. On the other hand, a flat-out repeal of the corporate income tax would simplify the tax code enormously and, if properly implemented, would not have a measurable impact on total revenues. (Corporate income taxes would, in this case, be collected as individual income taxes, as dividends are disbursed to shareholders.)
The Fiscal Picture in 10 Years
The June 2017 projections by the CBO estimate the evolution of the federal budget until 2027 under current law. In broad terms, expenditures are projected to rise significantly over the next decade, to 23.6 percent of GDP, while revenues will increase modestly to 18.4 percent of GDP. (See Figures 1 and 2.) The CBO projects rising deficits (See Figure 3.) and further accumulation of government debt. By 2027, government debt held by the public is expected to surpass 90 percent of GDP. (See Figure 4.)
Although discretionary spending as a share of GDP is expected to continue on its declining path, contracting by about 1 percentage point of GDP over the next decade, mandatory spending is expected to increase significantly. In particular, the combined expenditures on Social Security and health care programs are projected to go from 10.4 percent of GDP in 2016 to 12.9 percent in 2027. Other mandatory spending items are not expected to change significantly as a proportion of GDP.
A nontrivial part of the projected increase in spending over the next decade is attributed to larger interest payments on the debt, as both the interest rate on bonds closes on precrisis levels and outstanding debt rises. It is debatable whether interest rates will return to their precrisis levels, and there are reasons to believe that they will remain low (in part due to innovations in the financial system). If this turns out to be the case, the projected deficits are overstated by perhaps as much as 1 percentage point of GDP.
On the other hand, the modest projected increase in revenues may be overstated as well. As the CBO recognizes, part of the increase in individual income taxes is due to real “bracket creep,” that is, as income increases faster than consumer prices, larger proportions of income are subject to higher tax rates. It is conceivable that, due to equity considerations, Congress would prevent significant proportions of middle-class taxpayers from being subjected to higher tax rates. In such a case, revenues would not increase as expected, so the deficit might be higher than projected.
Narrowing Options
The federal budget is currently burdened by high obligations on Social Security payments and health care expenditures. In contrast, discretionary items are in decline. The prominence of mandatory spending programs implies less room for fiscal maneuvers in the future and will make reform more difficult to implement. Financing of these expenditures relies heavily on taxing individual income (including payroll taxes). Closing the deficit without reforming entitlements will invariably lead to tax hikes.
As I argued before, the federal government cannot rely on tax hikes on the rich, as these would have to be massive and may not even be enough.6 Most likely, taxes on the middle class would have to be raised. If anything, the political climate for a while has been pointing in the opposite direction (i.e., tax relief for the middle class).
Government debt levels are not yet a cause for concern in the U.S., although they might make fiscal responses to future recessions harder to implement. If current trends persist, debt held by the public will remain at manageable levels for the next decade. Another big adverse shock to the economy might change this outlook for the worse. Even in this case, the U.S. has the advantage of issuing debt in its own currency, so outright default (as in Greece) is not a likely outcome, though inflation might be (as was the case during and immediately after World War II).
Fernando Martin is an economist at the Federal Reserve Bank of St. Louis. For more on his work, see https://research.stlouisfed.org/econ/martin. Research assistance was provided by Andrew Spewak, a senior research associate at the Bank.
Endnotes
- The U.S. government’s fiscal year begins Oct. 1 and ends Sept. 30 of the subsequent year and is designated by the year in which it ends. Unless otherwise stated, all years refer to fiscal years. [back to text]
- Government debt held by the public excludes holdings by federal agencies (mainly, the Social Security trust funds), but includes holdings by the Federal Reserve System. [back to text]
- See Becker Friedman Institute. [back to text]
- Offsetting receipts are certain fees and other charges that are recorded as negative outlays. [back to text]
- See Auerbach (2007) and Auerbach and Poterba (1987). [back to text]
- See Martin. [back to text]
References
Auerbach, Alan J. Why Have Corporate Tax Revenues Declined? Another Look. CESifo Economic Studies, June 2007, Vol. 53, No. 2, pp. 153-71.
Auerbach, Alan J.; and Poterba, James M. Why Have Corporate Tax Revenues Declined? Working Paper No. 2118, National Bureau of Economic Research, January 1987.
Becker Friedman Institute for Research in Economics, University of Chicago. Milton Friedman in His Own Words. See https://bfi.uchicago.edu/news/post/milton-friedman-his-own-words.
Martin, Fernando M. A Closer Look at Federal Income Taxes. Economic Synopses, No. 23, 2016. See https://research.stlouisfed.org/publications/economic-synopses/2016/11/04/a-closer-look-at-federal-income-taxes.

Views expressed in Regional Economist are not necessarily those of the St. Louis Fed or Federal Reserve System.
For the latest insights from our economists and other St. Louis Fed experts, visit On the Economy and subscribe.
Email Us