Business Dynamism in the Eighth District
KEY TAKEAWAYS
- Business dynamism rates in the Eighth District are slightly lower than in the rest of the country, but not in all places.
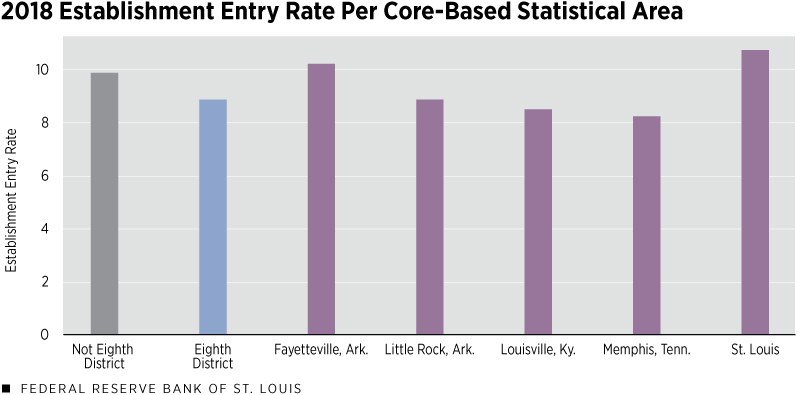
- The St. Louis and Fayetteville, Ark., rates are slightly higher than the average for the rest of the U.S., while Louisville, Ky., and Memphis, Tenn., are below that average.
- The generally lower business dynamism rates in Eighth District cities may be related to population.
High levels of business dynamism are one indicator of a healthy economy. Business dynamism can be measured as the rate of jobs created or destroyed, firms entering or exiting an area, and establishments entering and exiting the marketplace. An establishment is a single physical location where business activity takes place, as defined by the Bureau of Labor Statistics. A firm is an establishment or combination of establishments.
Since the 1980s, dynamism rates have fallen nationally, but the decline has been unequal across U.S. cities. Small cities have seen larger decreases than big cities, and today, big cities exhibit much faster rates of business dynamism than small ones.
In this article, we examine how business dynamism in the Eighth Federal Reserve District The Eighth Federal Reserve District includes all of Arkansas, eastern Missouri, southern Indiana, southern Illinois, western Kentucky, western Tennessee and northern Mississippi. compares with that of the rest of the economy, using establishment entry as our main measure.
Average Dynamism Inside and Outside the Eighth District
We examined average rates of business dynamism for cities within the Eighth District and cities outside it. The primary data set for this analysis is from the Census Bureau’s Business Dynamics Statistics. The data provide information on the number of firms and establishments, as well as jobs created and destroyed by firm and establishment age, and are available at the core-based statistical area (CBSA) sector level. A CBSA includes micropolitan and metropolitan statistical areas. A micropolitan statistical area contains 10,000 people or more and a metropolitan statistical area contains 50,000 people or more.
In the first figure, the blue and gray bars show the five-year average of the establishment entry rate The establishment entry rate is calculated as the number of new establishments divided by the total number of establishments. for cities inside and outside the Eighth District in 2018. To create a five-year moving average across the District, we took the average of the establishment entry rate for 2014 to 2018 in each District CBSA.

SOURCES: Business Dynamics Statistics, the Longitudinal Business Database and authors’ calculations.
Each bar displays the average of those rates, either in the Eighth District or across the rest of the United States; the Eighth District contains 85 CBSAs, while 832 CBSAs are outside it. The rate of establishment entry inside the Eighth District is about 1 percentage point below that of the rest of the U.S.
The purple bars in the first figure display the five-year average of the five largest District CBSAs. The rates in Louisville, Ky., and Memphis, Tenn., were slightly below the District average, while Little Rock, Ark., was about equal to it. Meanwhile, the rates of entry in St. Louis and Fayetteville, Ark., were slightly above the District average and above the national average outside Eighth District.
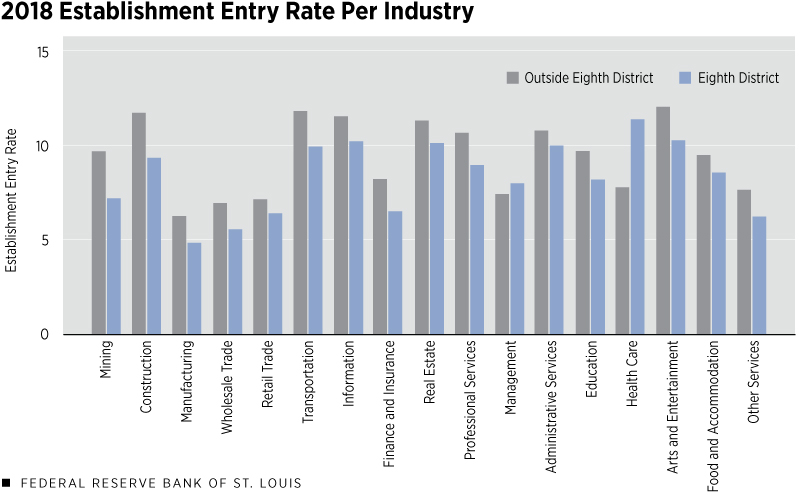
The second figure shows the establishment entry rate for different industries for cities inside the Eighth District and those outside it. The industry classifications used here are the same as the sector classifications in the North American Industry Classification System. For most of the industries listed, the rest of the country has a higher rate of establishment entry, with an average difference of 1.43 more new establishments for every 100 establishments.

SOURCES: Business Dynamics Statistics, the Longitudinal Business Database and authors’ calculations.
However, two industries were more dynamic in the Eighth District: health care and management. The Eighth District has roughly one more new management establishment for every 100 management establishments per year and 3.5 more new health care establishments for every 100 health care establishments than the outside region.
The overall rates of dynamism in the Eighth District are clearly different from the rest of the country, but this could be attributed to differences in industry composition. If individual industries have similar rates of dynamism inside and outside the Eighth District, the overall differences in dynamism could mean a higher proportion of less dynamic industries in the Eighth District. However, as seen in the second figure, the dynamism rate in the Eighth District across industries is lower than the rest of the country’s. Thus, industry composition cannot explain the difference in dynamism rates.
The Relationship between Population and Dynamism
While the rate of dynamism is lower in the Eighth District, cities like St. Louis remain above average for the District and the U.S. Since the 1980s, larger cities, on average, have become more dynamic than smaller cities, as described in a recent Economic Synopses article. The average population in an Eighth District CBSA is lower than the average CBSA outside the Eighth District.
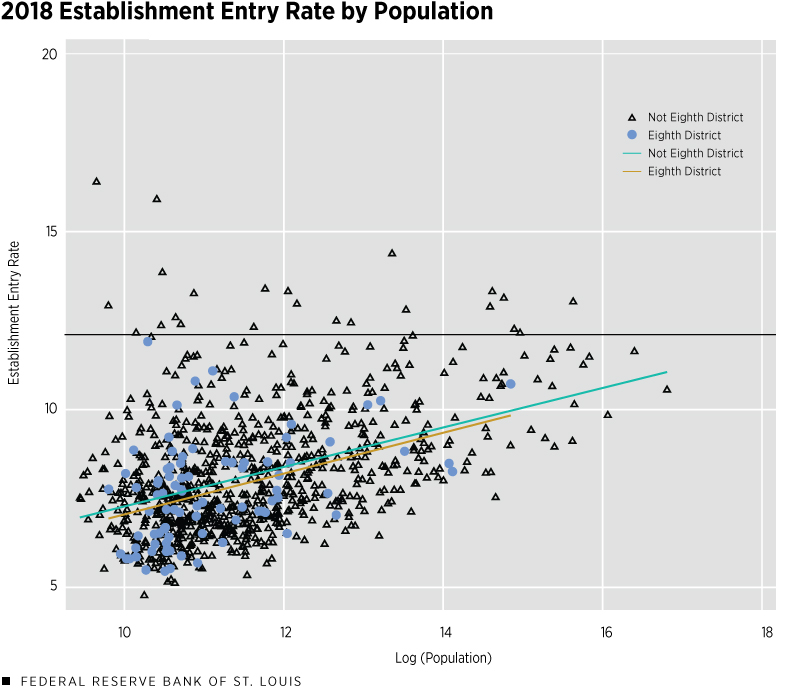
The scatterplot below compares the log of population in a particular CBSA with its establishment entry rate in 2018. The blue dots and the orange line cover the cities in the Eighth District, while the black triangles and the teal line describe the relationship between size and dynamism outside the Eighth District.

SOURCES: Business Dynamics Statistics, the Longitudinal Business Database and authors’ calculations.
While there are more and larger cities outside the District, the relationship between city size and dynamism is similar in both. The orange and teal lines nearly overlapping in the scatterplot indicate that the relationship between the two is similar, if not the same.
Thus, the likely cause of the lower dynamism rates is that cities in the Eighth District are smaller than cities outside the Eighth District. As described in the Economic Synopses article mentioned above, a higher population likely increases competition between firms. Higher competition means that unproductive firms are more likely to exit the market, leaving room for newer, more productive firms to enter it.
Conclusion
Dynamism rates in the Eighth District remain below the rates for the rest of the country overall and for most specific industries. The lower rates of dynamism in the Eighth District are persistent within most sectors, with the exception of health care and management. However, when compared with cities of similar sizes, there is no discernable difference in overall dynamism rates between Eighth District cities and cities outside the Eighth District.
Endnotes
- An establishment is a single physical location where business activity takes place, as defined by the Bureau of Labor Statistics. A firm is an establishment or combination of establishments.
- The Eighth Federal Reserve District includes all of Arkansas, eastern Missouri, southern Indiana, southern Illinois, western Kentucky, western Tennessee and northern Mississippi.
- A CBSA includes micropolitan and metropolitan statistical areas. A micropolitan statistical area contains 10,000 people or more and a metropolitan statistical area contains 50,000 people or more.
- The establishment entry rate is calculated as the number of new establishments divided by the total number of establishments.
Views expressed in Regional Economist are not necessarily those of the St. Louis Fed or Federal Reserve System.
For the latest insights from our economists and other St. Louis Fed experts, visit On the Economy and subscribe.
Email Us


