


Hospital Capacity amid the COVID-19 Pandemic
KEY TAKEAWAYS
- While the number of deaths from COVID-19 is of historic magnitude for the U.S., many health care systems around the nation have been able to manage the caseload.
- Our analysis indicates that most counties in the U.S. have not reached bed capacity between the start of the outbreak and the end of June.
- However, about one-quarter of counties are at risk of overcapacity in the event of a future surge in cases.
As COVID-19 spreads rapidly around the country, a major concern has been the ability of hospitals to admit and care for patients. Many states initially imposed stay-at-home orders, continuing to limit business activity in order to slow the spread of the virus and reduce the strain on health care systems. Although these polices have shown to be effective in managing the health crisis, they come at a great economic cost.See research by Garriga et al. (2020) and Baqaee et al. (2020) for a discussion of optimal policies for managing the public health and economic trade-offs.
While the number of deaths caused by COVID-19 is of historic magnitude for the U.S., many health care systems around the nation have been able to manage the caseload and treat patients during crisis. In this article, we examine one of the constraints on hospitals—specifically their capacity of beds—and the geographic disparities across the country.
Our analysis indicates that most counties in the U.S. did not reach maximum capacity during their respective peak growth in COVID-19 cases. However, about one-quarter of counties are at risk of overcapacity in the event of future surge in cases.The strain on hospitals is also financially due to declines in elective procedures. This is particularly true for rural hospitals. A recent report by the Chartis Center for Rural Health (PDF) found that approximately one-quarter of rural hospitals are vulnerable to closure.
Peak COVID-19 Cases: Metro vs. Rural Areas
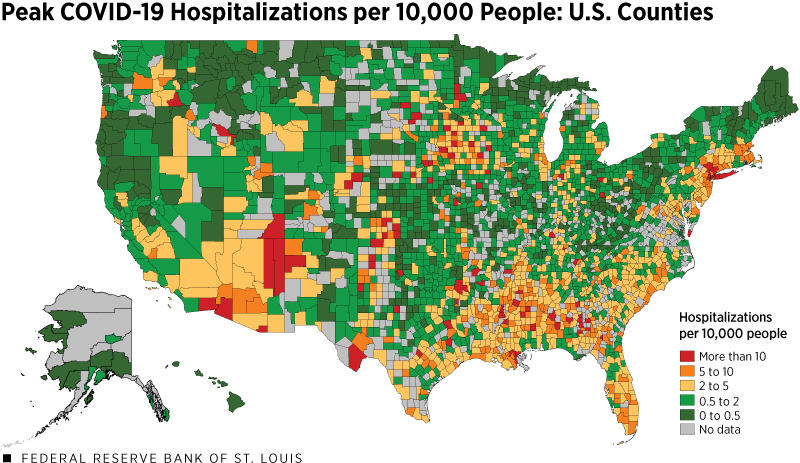
Figure 1 shows the geographic distribution of the largest increase in estimated hospitalizations per 10,000 people during any given two-week period through June 30. To calculate the number of hospitalizations at the county level, we assume a 12% probability of hospitalization conditional on being infected.
This probability is calculated as the national average of hospitalizations per case. We find that, on average, 12 out of 100 COVID-19 cases require hospitalization.Data on state-level hospitalization is from the Covid Tracking Project. The average share of COVID-19 cases requiring hospitalizations is calculated using daily data from 35 reporting states. This measure of hospitalizations is intended to highlight the areas that have been most impacted by COVID-19 throughout the US. Using the maximum two-week change allows us to account for variations in the timing of peak cases across counties.
SOURCES: USA Facts (accessed July 1), American Community Survey, Homeland Infrastructure Foundation-Level Data, the Covid Tracking Project and authors’ calculations.
NOTES: Population data for counties are for the year 2018, the latest available year in the ACS. The peak is the largest increase of estimated COVID-19 hospitalizations per 10,000 people during any given two-week period through June 30.
Many of the orange and yellow-shaded counties in the map are primarily metropolitan areas. At their peak, metropolitan areas averaged 8 new hospitalizations per 10,000 people in a two-week period, or almost twice as times as many per capita as rural areas. One likely reason for higher peak hospitalizations is higher population density in these areas, which makes social distancing more difficult and allows the virus to spread more rapidly.
Hospital Bed Capacity
We next study geographic differences in hospital bed capacity. Hospital bed capacity is defined as the ratio of total hospitalizations (which includes both COVID-19 and non-COVID-19 patients) to total beds. In our analysis, we assume that non-COVID-19 patients always occupy around 44% of beds. This assumption is based on the non-COVID-19 occupancy rate across states, which averages around 44%.Daily data on the number of inpatient beds occupied by non-COVID-19 patients is from the Centers for Disease Control and Prevention (from April 1 through June 30). Data on total number of beds is from the Homeland Infrastructure Foundation-Level Data.
Hospital bed capacity is generally lower in metropolitan areas. Table 1 summarizes average county hospital capacity by metropolitan, micropolitan and rural groupings.Metropolitan and micropolitan areas are defined by the Office of Management and Budget. Metropolitan areas are a group of counties with economic linkages and at least one principal city with a population over 50,000. Micropolitan areas as similarly defined with principal city population over 10,000 but less than 50,000.
Although metropolitan areas have greater absolute capacity (measured by average number of beds), rural areas have greater relative capacity (measured by the average number of beds per capita). Access to hospitals may still be difficult in rural areas, as households may need to travel long distances for treatment.
| County | Hospital Beds | Hospital Beds
(per 10,000 People) |
Peak COVID Hospitalizations during Two-Week Period (per 10,000 People) |
|---|---|---|---|
| Metro | 463 | 15 | 8.0 |
| Micro | 57 | 14 | 6.7 |
| Rural | 23 | 19 | 4.6 |
| SOURCES: USA Facts (accessed July 1), American Community Survey, Homeland Infrastructure Foundation-Level Data and authors’ calculations. | |||
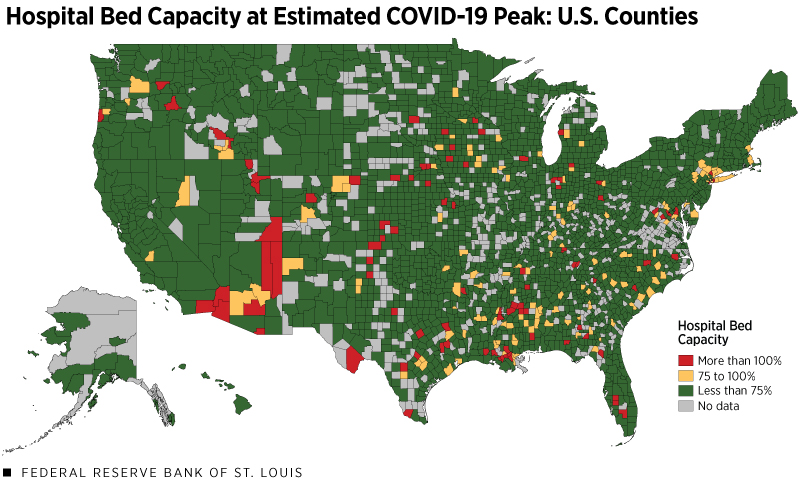
Have hospitals across the country had the capacity to handle the number of hospitalizations? Figure 2 maps the largest two-week change in estimated hospitalizations relative the number of available beds in each county.
This reflects our estimate of the peak strain on hospital capacity through June 30. The estimate requires the two aforementioned assumptions about the share of cases requiring hospitalization and the share of beds used for non-COVID-19 reasons. We also assume that these shares are constant across counties and time. It is important to note that this estimate does not account for the shortage of hospital staff, protective equipment or other critical equipment, such as ventilators. Thus, the measure of available beds only captures a hospital’s capacity to house patients, not the effectiveness of treatment.
SOURCES: USA Facts (accessed July 1), American Community Survey, Homeland Infrastructure Foundation-Level Data, Centers for Disease Control and Prevention, the Covid Tracking Project and authors’ calculations. The peak is the largest increase of estimated hospitalizations per 10,000 people during any given two-week period through June 30.
NOTE: Population data for counties are for the year 2018, the latest available year in the ACS.
With these caveats, our analysis indicates that hospital resources have likely reached capacity in a few areas of the country, particularly in counties within Arizona, Louisiana and Texas. This is consistent with anecdotal reports of cities constructing temporary facilities. However, despite the spike in new cases at the end of June, 96% of counties stayed at or below hospital bed capacity with 91% of all counties at less than 75% capacity.
Capacity and Another COVID-19 Surge
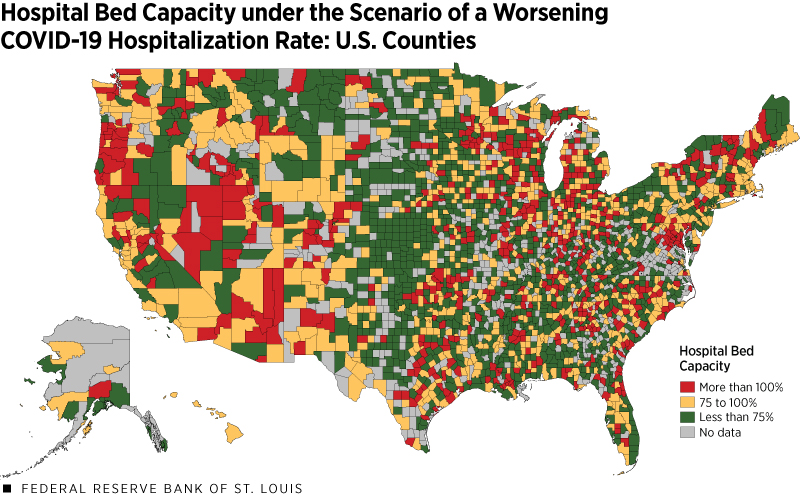
While social distancing measures and government stay-at-home orders have mitigated the strain on hospital systems, there continue to be regional spikes in new cases. Recent increases in Texas, Florida and Arizona have resulted in officials temporarily halting reopening plans. As economies begin to reopen, some counties are operating with less room to handle an increase in new cases.
To study the strain to the hospital system due to regional spikes we modeled a severe case in which hospitalizations per capita rise to 9 per 10,000 people. This represents the 95th percentile of cases per capita at the county level.The magnitude of our assumed two-week spike is based on the current U.S. experience, not an epidemiological model. We also assumed that the number of available hospital beds remained constant, as adding infrastructure to hospitals is costly and cannot be done on short notice.Many regions have developed temporary sites providing more beds to support their patients. Our analysis does not account for this potential expansion. Figure 3 maps this scenario.
SOURCES: USA Facts (accessed July 1), American Community Survey, Homeland Infrastructure Foundation-Level Data, CDC, the Covid Tracking Project and authors’ calculations.
NOTE: Population data for counties are for the year 2018, the latest available year in the ACS.
This map paints a very different picture of hospital capacity across the U.S. Only 77% of counties would have sufficient bed capacity to handle all new COVID-19 cases under this scenario and remain below 100% capacity on beds. Half of counties would be above 75% capacity.
We should note that another assumption underlying our analysis is that all counties provide similar access to testing. While testing data at the county level is not readily available to verify this assumption, some evidence shows that rural areas might be facing distinct challenges in accessing testing kits.
For instance, testing data from the Covid Tracking Project at the state level show that Alabama (which has many rural counties) has conducted 406,652 tests through the end of June, or 82 tests per 1,000 people. On the other hand, New York (with many urban areas) has conducted more than five times as many tests per capita, at 466 tests per 1,000 people. Assuming asymptomatic people are less likely to be tested when testing is constrained, more widespread testing could reduce our assumption that 12% of cases require hospitalization.
A Closer Look at the Eighth Federal Reserve District
The Eighth Federal Reserve DistrictHeadquartered in St. Louis, the Eighth Federal Reserve District includes all of Arkansas and parts of Illinois, Indiana, Kentucky, Mississippi, Missouri and Tennessee. had 72,217 COVID-19 cases as of June 30 and relative hospital bed capacity averages around 3 per 1,000 people. The average occupancy rate for hospitals in the Eighth District is around 44%, which is in line with the national trend.
For 98% of counties, the peak in new cases was well below hospital bed capacity. In 92% of counties, the peak was less than 75% of capacity. Under the scenario where hospitalizations rise to 9 in 10,000 people, 57% of counties in the Eighth District would have sufficient bed capacity to handle all new COVID-19 cases and remain below 75% capacity on beds, while around 78% of counties would remain at or below 100% capacity.
Conclusion
Many reports note that the health care system is facing severe shortages in terms of equipment and hospital beds as the U.S. manages the COVID-19 outbreak. This article attempts to capture these effects by examining the number of COVID-19 cases per hospital beds to study the magnitude of supply shortages.
We found that hospitals in 4% of counties—most of which are urban—may have been above capacity when new cases reached a peak. While this number may suggest sufficient capacity in many counties in the U.S., it is primarily due to lower infection rates in other areas. We found that 23% of counties would be above capacity with a surge in new cases similar to that of the worst hit counties in the U.S.
States across the country are paying increasing attention to hospital capacity as they reopen. For instance, New York’s plan to reopen includes monitoring the bed vacancy rate, with the desirable vacancy rate being greater than 30% of available beds (or 70% capacity by our metric). While our measure does not provide the exact hospital bed vacancy at any given moment in time, it is still a useful benchmark since it reflects the maximum strain that hospital systems across the country are capable of handling.
The article also raises broader questions about the optimal level of investment into health care capacity in an unfortunate situation of a surge in COVID-19 cases or another health crisis. Society may find it optimal to invest in excess capacity as a way to mitigate the economic impact of health crises.
Endnotes
- See research by Garriga et al. (2020) and Baqaee et al. (2020) for a discussion of optimal policies for managing the public health and economic trade-offs.
- The strain on hospitals is also financially due to declines in elective procedures. This is particularly true for rural hospitals. A recent report by the Chartis Center for Rural Health (PDF) found that approximately one-quarter of rural hospitals are vulnerable to closure.
- Data on state-level hospitalization is from the Covid Tracking Project. The average share of COVID-19 cases requiring hospitalizations is calculated using daily data from 35 reporting states.
- Daily data on the number of inpatient beds occupied by non-COVID-19 patients is from the Centers for Disease Control and Prevention (from April 1 through June 30). Data on total number of beds is from the Homeland Infrastructure Foundation-Level Data.
- Metropolitan and micropolitan areas are defined by the Office of Management and Budget. Metropolitan areas are a group of counties with economic linkages and at least one principal city with a population over 50,000. Micropolitan areas as similarly defined with principal city population over 10,000 but less than 50,000.
- The magnitude of our assumed two-week spike is based on the current U.S. experience, not an epidemiological model.
- Many regions have developed temporary sites providing more beds to support their patients. Our analysis does not account for this potential expansion.
- Headquartered in St. Louis, the Eighth Federal Reserve District includes all of Arkansas and parts of Illinois, Indiana, Kentucky, Mississippi, Missouri and Tennessee.
References
Garriga, Carlos; Manuelli, Rody; and Sanghi, Sid. “Preliminary: Optimal Management of COVID-19 Epidemic: When and How to Reopen the Economy?” Federal Reserve Bank of St. Louis research website, May 13, 2020.
Baqaee, David; Farhi, Emmanuel; Mina, Michael J.; and Stock, James. “Policies for a second wave.” Brookings, June 25, 2020.


Views expressed in Regional Economist are not necessarily those of the St. Louis Fed or Federal Reserve System.
For the latest insights from our economists and other St. Louis Fed experts, visit On the Economy and subscribe.
Email Us