


Economic Uncertainty Means Approaching GDP Forecasts with Caution
KEY TAKEAWAYS
- The longest expansion in U.S. history ended in February, largely due to economic fallout from the COVID-19 pandemic.
- The economic collapse due to the pandemic, however, means the second-quarter decline in GDP could be the largest decline on record.
- Forecasts of an economic rebound are prevalent, but so much economic uncertainty means such forecasts should be viewed with caution.
The U.S. economy entered into a recession sometime in February 2020. It is highly likely that the longest expansion in recorded U.S. economic history—which began in June 2009—would not have ended without the collapse in economic activity stemming from the COVID-19 pandemic. Indeed, the decline in real gross domestic product (GDP) in the second quarter could be the largest in recorded U.S. economic history.
But with activity picking up in May and June, economic conditions will likely be much better over the second half of the year. However, the recent spike in COVID-19 cases and continued elevated rates of economic uncertainty suggest policymakers will proceed cautiously.
A GDP Decline for the Record Books
On March 16, President Trump issued guidelines for public gatherings—including travel and eating out—in response to the pandemic. Most states subsequently issued “stay-at-home” orders and social distancing protocols designed to stem the pandemic.For more on actions and responses, see FRASER’s Timeline of Events Related to the COVID-19 Pandemic.
These actions triggered widespread turmoil in financial markets and a plunge in economic activity across a wide swath of the economy in March and April. Labor markets bore the brunt of the collapse in spending: Nonfarm payrolls fell by a little more than 22 million combined in March and April, and the unemployment rate surged from 3.5% in February to 14.7% in April. Although the bulk of the decline in first-quarter activity occurred in March, real GDP still fell at a relatively large 5% annual rate.
Policymaker Response to Economic Decline
In response to the unfolding calamity, fiscal and monetary policymakers swung into action.
First, the Federal Reserve made several moves:
- Reducing interest rates to near zero
- Ramping up purchases of Treasury and mortgage-backed securities
- Reopening some of the lending facilities that were put in place during the financial crisis
Next, several new lending facilities were implemented in conjunction with Treasury under section 13(3) of the Federal Reserve Act. Fiscal policymakers also acted aggressively. Several pandemic-related bills were signed into law, totaling about $2.8 trillion in stimulus spending.
In response to the massive fiscal stimulus, the Congressional Budget Office now projects that the budget deficit in fiscal year 2020 will be $3.7 trillion, nearly 18% of GDP. If realized, it would be the largest deficit since 1945.
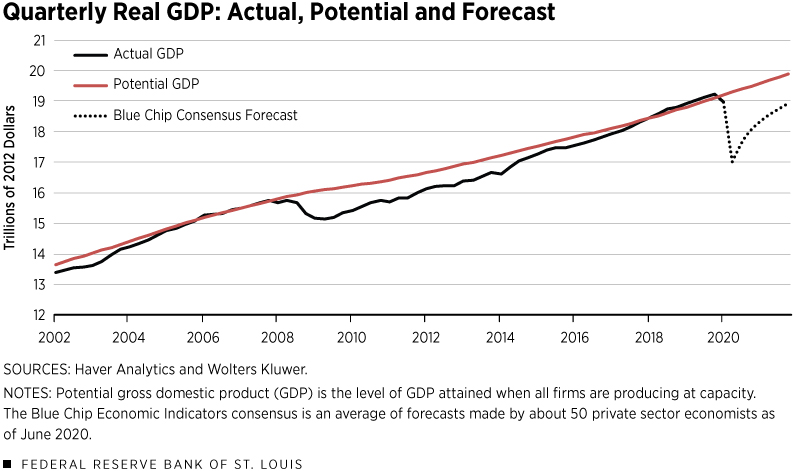
These actions have helped to stabilize financial markets and cushion the collapse in economic activity. Still, the decline in real GDP in the second quarter could be historic, because several key economic indicators—such as consumer spending, industrial production and housing starts—posted record one-month declines (in percentage terms) in April. The consensus from Blue Chip Economic Indicators in early June was that real GDP would decline at about a 36% annual rate in the second quarter.
Hoping for a Slingshot Effect
Loosening social distancing protocols—combined with the economic stimulus provided by monetary and fiscal policymakers—spurred a marked rebound in the pace of economic activity in May. For example, nonfarm payrolls increased by about 2.5 million, and the unemployment rate retreated to 13.3%. More than 15 million people were on temporary layoff in May. Thus, these workers should rejoin the ranks of the employed as business activity resumes.
But if the stay-at-home orders triggered large numbers of bankruptcies and permanent job losses, then the unemployment rate could remain elevated for longer than expected.
Despite these concerns, consumers have spent a chunk of their accumulated savings in March and April, as auto sales surged by 40% in May and retail sales rose by a record-busting 17.7%. Airline travel and dining out have further increased in June, and automotive manufacturers are ramping up production.
With the economy on the mend, the Blue Chip consensus projects that annualized real GDP growth will average about 13% in the second half of 2020 and about 5.75% over the first half of 2021. For the year, though, forecasters expect real GDP to contract by 6.1% in 2020, but then increase by 4.8% in 2021.The Federal Reserve’s convention is to measure yearly growth rates as the percent change from the fourth quarter of one year to the fourth quarter of the following year.
The Pandemic’s Effect on Prices
The pandemic has triggered a temporary bout of deflation. Through the first five months of the year, the personal consumption expenditures price index (PCEPI) declined at a 0.9% annual rate.A falling price level reflects lower prices of many goods and services—such as gasoline, airfare and lodging away from home—that stemmed from the collapse in demand for goods and services. By comparison, the PCEPI had increased at a 1.5% rate over the first five months of 2019.
As economic activity continues to rebound, prices should rise. Indeed, crude oil and retail gasoline prices in mid- to late June were at three-month highs, though still well below year earlier levels. Moreover, longer-term inflation expectations have remained positive.
Summary
The COVID-19 pandemic—like all pandemics—will come to an end. Of course, nobody knows when that will be. No one also knows whether there will be subsequent waves of the virus that trigger a nationwide resumption of strict social distancing protocols or whether a proven vaccine allows a swift return to pre-COVID norms. Thus, the trajectory of the recovery is the key unknown at this point.
Certainly, the economy appears to have turned the corner, and forecasters generally see a robust recovery. However, forecasts during periods of high uncertainty must nonetheless be viewed cautiously.
Kathryn Bokun, a research associate at the Bank, provided research assistance.
Endnotes
- For more on actions and responses, see FRASER’s Timeline of Events Related to the COVID-19 Pandemic.
- The Federal Reserve’s convention is to measure yearly growth rates as the percent change from the fourth quarter of one year to the fourth quarter of the following year.
- A falling price level reflects lower prices of many goods and services—such as gasoline, airfare and lodging away from home—that stemmed from the collapse in demand for goods and services.

Views expressed in Regional Economist are not necessarily those of the St. Louis Fed or Federal Reserve System.
For the latest insights from our economists and other St. Louis Fed experts, visit On the Economy and subscribe.
Email Us