U.S. GDP Shows Surprising Strength, But Challenges Remain
KEY TAKEAWAYS
- U.S. real GDP growth surprised to the upside in the first quarter of 2019. But some key data have been mixed, and the U.S.-China trade dispute remains a wild card.
- Continued strength in the U.S. job market and an upswing in labor productivity are positive developments.
- Rebounding crude prices firmed up inflation in March and April, but forecasters still see inflation averaging 2% over the next 10 years.

U.S. real gross domestic product (GDP) growth surprised to the upside in the first quarter of 2019, after posting its strongest rate of growth in more than a dozen years in 2018. The stronger-than-expected start to the year caused some forecasters to pencil in faster real GDP growth in 2019.
Still, some key economic data have been mixed, and a few models are showing elevated recession probabilities over the next four quarters. By contrast, labor market conditions, which are a usually reliable indicator of cyclical strength or weakness, continue to show scant evidence that firms are preparing for a sales slowdown.
One wild card is the ongoing trade dispute with China, which has rattled financial market participants in both countries and elevated measures of business uncertainty. On balance, though, the sentiment in financial markets remains mostly bullish. A key reason is that the latest projections by the Federal Open Market Committee (FOMC) now show the likelihood of no further rate hikes in 2019.
Healthy Labor Markets and Strong Productivity
The pace of U.S. economic activity was stronger than expected in the first quarter; real GDP rose at a 3.2% annual rate, according to the advance estimate. This increase was more than twice the rate predicted by the forecast consensus in the March 2019 Survey of Professional Forecasters and 1 percentage point more than the modest growth registered in the fourth quarter of 2018. However, the underlying details of the first-quarter report were a bit softer, as growth of consumption spending and business fixed investment slowed measurably from the previous quarter. Notably, inventory investment also strengthened, so that the growth of final sales (real GDP less inventory investment) was modestly slower (2.5%) than the top-line growth rate.
Gauging the pace of economic activity over the near term is challenging for a couple of reasons. First, ongoing geopolitical developments have helped to keep measures of economic policy uncertainty at elevated levels. When uncertainty is high and rising, this tends to have a depressing effect on business capital expenditures and consumer durable goods purchases.
Second, some of the key economic indicators have been mixed, with seemingly every strong number offset by a weak number. For example, retail sales surged in March, but light-vehicle sales fell sharply in April. Similarly, new orders for manufactured durable goods rose sharply in March, but industrial production unexpectedly fell slightly in the same month. Private construction outlays fell sharply in March, but new home sales have risen sharply for three straight months. Available data for April also depict a mixed bag of good and not-so-good economic conditions.
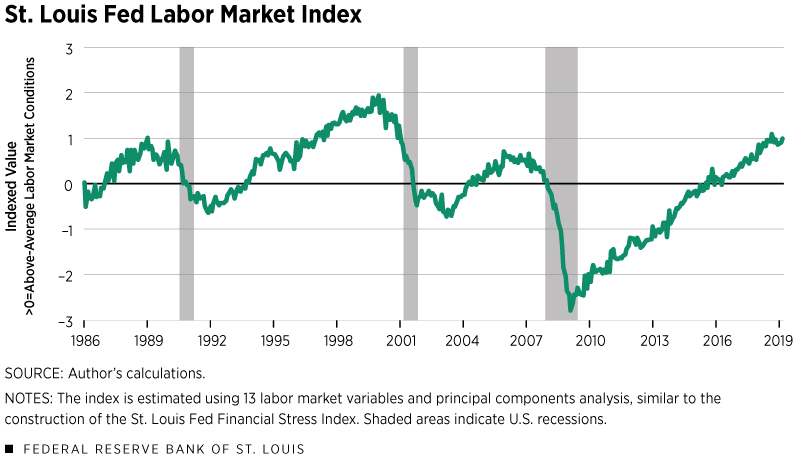
Still, there have been other positive developments that portray solid economic fundamentals. Importantly, labor market conditions remain strong. In April, payroll employment rose by a stronger-than-expected 263,000 jobs, and the unemployment rate fell 0.2 percentage points to 3.6%. Moreover, job openings remain near historic highs and continue to exceed the number of those unemployed and actively seeking work. As noted in the accompanying figure, a broad measure of labor market conditions shows no signs that firms are poised to materially reduce staffing levels.
Another exceptionally positive development has been the marked upswing in labor productivity. In the first quarter of 2019, output per hour in the nonfarm business sector was up by an impressive 2.4% from a year earlier—its largest increase in eight and a half years. If this strong productivity growth persists, forecasters and policymakers will need to revisit their medium-term real GDP growth forecasts.
Oil Prices Rebound, Inflation Follows
Sharp declines in crude oil prices over the second half of 2018 triggered a substantial moderation in headline inflation pressures that spilled over to early 2019. In the first quarter of 2019, the Fed’s preferred price index—the personal consumption expenditure price index (PCEPI)—was up 1.4% from a year earlier, the smallest increase in a little more than two years. By contrast, other inflation measures are closer to the FOMC’s 2% inflation target. For example, the year-over-year change in the Dallas Fed’s trimmed-mean PCEPI inflation rate was 2% in March and 1.9% in the first quarter of 2019.
Owing to a rebound in crude oil prices in 2019, headline inflation firmed in March and April. As a result, the total consumer price index (CPI) has increased at a 2.7% annual rate over the first four months of 2019—a modest acceleration from the same period a year earlier (2.5%). Although market-based measures of long-term inflation expectations have seesawed this year, they remain near 2% and up slightly since the end of 2018. For their part, professional forecasters still expect PCEPI inflation to average 2% over the next 10 years.
Kathryn Bokun, a research associate at the Bank, provided research assistance.
Views expressed in Regional Economist are not necessarily those of the St. Louis Fed or Federal Reserve System.
For the latest insights from our economists and other St. Louis Fed experts, visit On the Economy and subscribe.
Email Us


