


Gauging Debt Levels in the U.S. and Eighth District
KEY TAKEAWAYS
- In nominal terms, U.S. household debt continues to grow, exceeding a peak set in 2008. Is this cause for concern?
- In real terms, debt isn’t at a new high. And the recent increase has been modest compared to the debt run-up before the Great Recession.
- Though the rate of serious delinquency is rising in both the U.S. and Eighth District, the increase doesn’t appear to be troublesome.

In May, the Federal Reserve Bank of New York released its latest version of the Household Debt and Credit Report, which reported data for the first quarter of 2018. A key finding in this report is the continued increase in household debt. In fact, in the first quarter, nominal household debt reached $12.8 trillion, exceeding the prior peak of $12.7 trillion in 2008. Of course, shortly after the peak in 2008, a period of deleveraging occurred amid the Great Recession.
In this article, we look more closely at the recent developments in household debt accumulation nationally and in the Eighth District.Headquartered in St. Louis, the Eighth Federal Reserve District includes all of Arkansas and parts of Illinois, Indiana, Kentucky, Mississippi, Missouri and Tennessee. One of the key findings is that household debt is increasing, but it has not yet reached the level observed in 2008 if adjustments are made for inflation. Also, the cause of the debt run-up in 2008 was mortgage debt. By contrast, consumer credit card debt and auto debt are the key drivers in the more recent increase.
The Household Debt and Credit Report (HDCR) is based on an anonymized 5 percent sample of credit files assembled from data provided by the credit monitoring company Equifax. This data set is named the Equifax/Federal Reserve Bank of New York Consumer Credit Panel (CCP). We use this data to examine credit developments in the United States as well as in the Eighth District.Later this year, we will write a companion piece that looks at developments in the major metropolitan statistical areas within the Eighth District.
While we use the same data as in the HDCR, we make two adjustments. First, we use a different definition of total consumer debt. The New York Fed includes student debt; in this research, total consumer debt does not include student debt. The reason for the exclusion of individual student debt data is that this data was not consistently reported prior to 2006.
Second, we express all debt in inflation-adjusted values, whereas the HDCR reports nominal values of debt. We use the personal consumption expenditures (PCE) chain-type price index to adjust for inflation. In addition, we normalize each series so that the value is equal to 100 in the first quarter of 2003.
Figure 1 shows total inflation-adjusted consumer debt for the U.S. and the Eighth District; the Great Recession (December 2007 to June 2009) is highlighted by the gray bar.
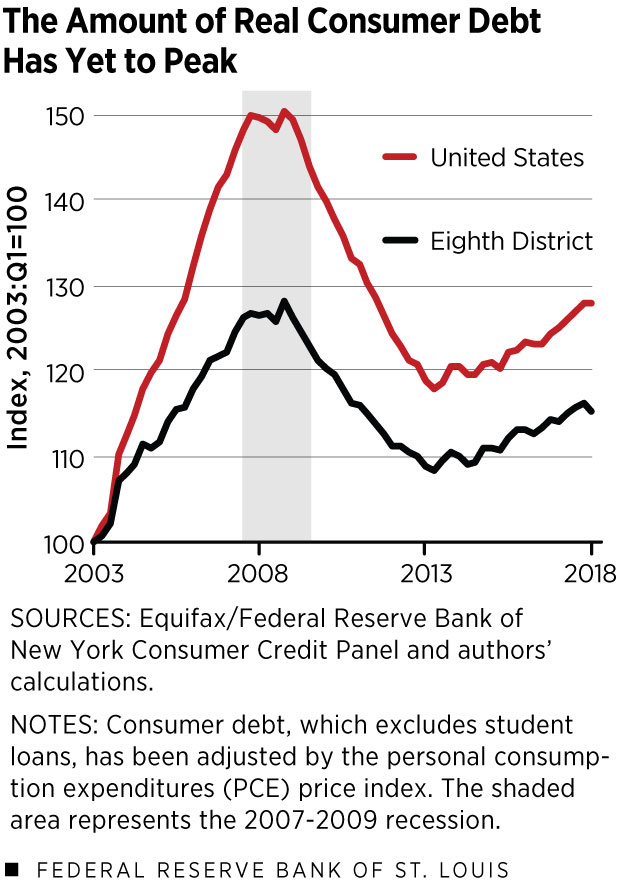
Clearly, consumer debt was increasing rapidly before it peaked during the recession. It is also clear that the run-up in consumer debt in the Eighth District was much smaller than in the entire economy. The explanation lies with mortgage debt. The housing sector boom in the Eighth District was much smaller compared to that of other regions. As a result, the increase in mortgage debt was smaller.
Since the latter part of 2013, total real consumer debt has increased once again, but this growth has been modest compared to the increase observed prior to the Great Recession.
Is a Debt Crisis on the Horizon?
The fact that real consumer debt is increasing in both the entire economy and the Eighth District leads to the question: Is another debt crisis on the horizon? In order to answer this question, we refer to Figure 2, where the major categories of consumer debt—auto debt, consumer credit card debt, home equity line of credit (HELOC) debtHELOC debt is simply borrowing on the equity a homeowner has accrued on the home owned. and mortgage debt—are reported.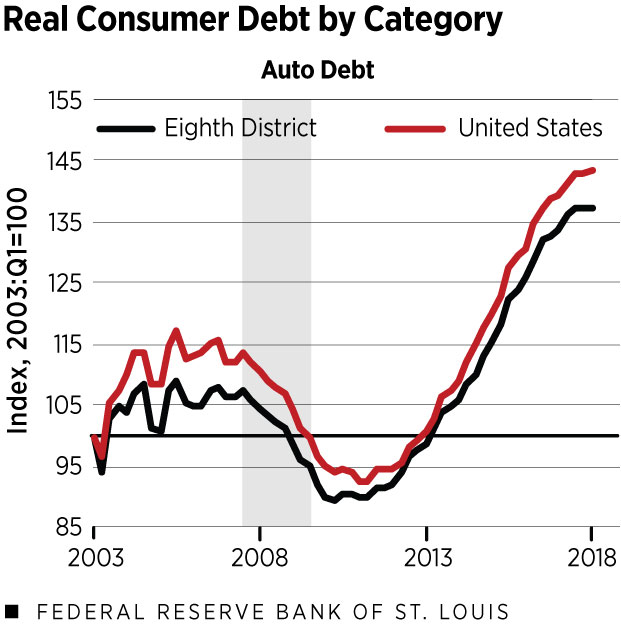
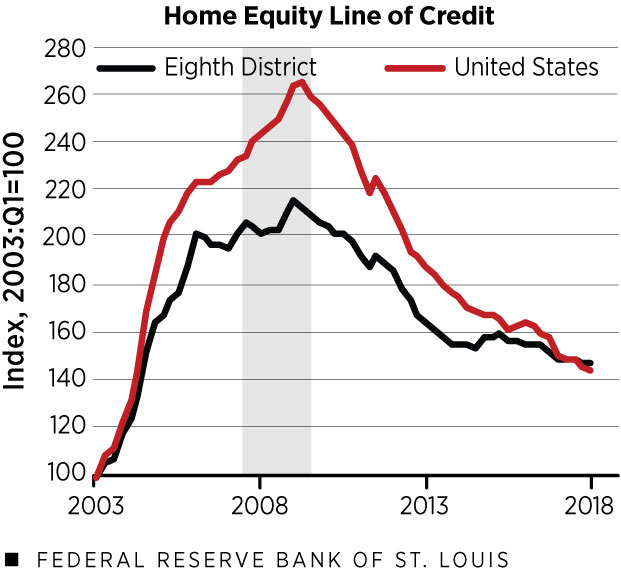
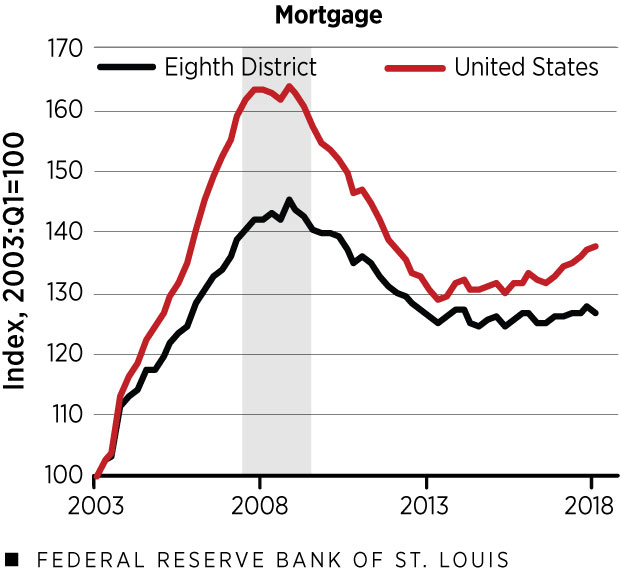
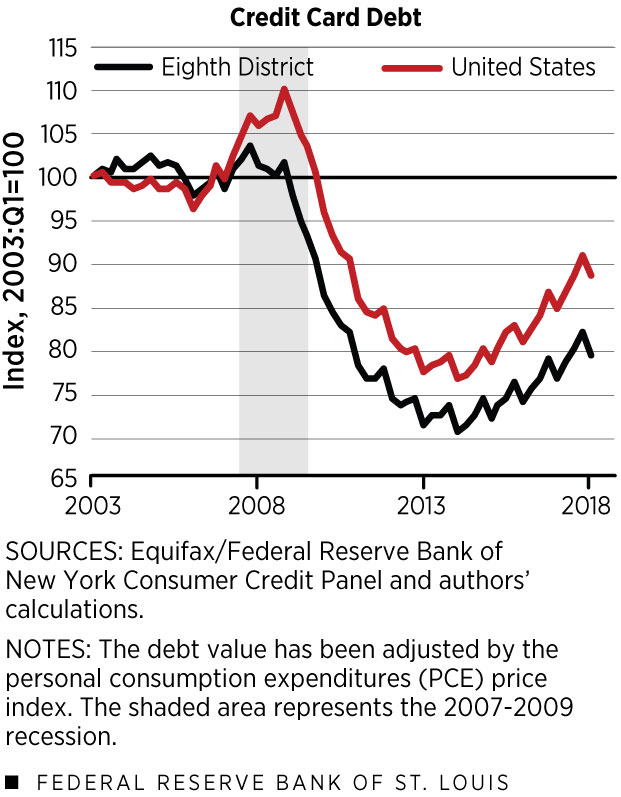
As can be seen, the real value of mortgage debt has increased very slowly compared to the pre-Great Recession trend. In the Eighth District, the trends mirror the national trends. Specifically, HELOC debt has continued to decline. The real value of auto debt has increased since 2012, while consumer credit card debt has been generally increasing since 2014.
In the first quarter of 2018, the latest quarter for which data is available, consumer credit card debt increased nationally by 4.5 percent from the first quarter of 2017 and rose 3.1 percent in the Eighth District. In both cases, this increase is partially explained by the effect of the prior holiday season. Meanwhile, mortgage debt increased by 2.4 percent nationally; in the District, mortgage debt essentially did not change.
Auto debt increased both nationally and in the District, though growth has been easing since the second quarter of 2017. In contrast, HELOC debt declined nationally by 4.4 percent and by 1.4 percent in the District.
The Delinquency Problem
The increase in both credit card and auto debt has raised concerns in the popular press. No doubt these concerns are partially the result of memories of the role that mortgage debt played in causing the Great Recession.
Yet, debt is only a problem if it is defaulted upon. One approach to gauge the risk of future defaults is to examine the serious-delinquency rate, which is defined as the share of debt that is past-due 90 days or more. In the Eighth District, delinquency rates did increase. However, the year-over-year increase was only 0.5 percentage points for auto debt and 0.4 percentage points for credit card debt. Changes in delinquency rates were of similar size nationally.
These increases are not troublesome. Yet, some may argue that these increases may signal future increases in delinquency rates, especially for auto debt. Their reasoning is that the auto industry, like the housing industry prior to the Great Recession, is relying on subprime lending to further increase auto sales. Our data set, however, allows us to gain some insight into this argument as credit scores are available for the set of individuals in our sample.
We identify a subprime debt as an individual with a credit score in the 280-619 range. In the first quarter of 2018, the most recent data available, we found that the total real value of new auto loans to subprime borrowers dropped by 10.1 percent year-over-year in the Eighth District, while they increased by 2.4 percent in the U.S. If the declining pattern continues, the subprime concern over how auto sales are being financed should be lessened in the Eighth District.
Endnotes
- Headquartered in St. Louis, the Eighth Federal Reserve District includes all of Arkansas and parts of Illinois, Indiana, Kentucky, Mississippi, Missouri and Tennessee.
- Later this year, we will write a companion piece that looks at developments in the major metropolitan statistical areas within the Eighth District.
- HELOC debt is simply borrowing on the equity a homeowner has accrued on the home owned.


Views expressed in Regional Economist are not necessarily those of the St. Louis Fed or Federal Reserve System.
For the latest insights from our economists and other St. Louis Fed experts, visit On the Economy and subscribe.
Email Us