


Banking Deserts Become a Concern as Branches Dry Up
Although changes in technology have made it easy to conduct some banking transactions from almost anywhere, personal and public benefits are still derived from proximity to a bank branch.
In areas without branches—commonly referred to as “banking deserts”—costs and inconveniences of cashing checks, establishing deposit accounts, obtaining loans and maintaining banking relationships are exacerbated.
The closing of thousands of bank branches in the aftermath of the 2007-09 recession has served to intensify societal concerns about access to financial services among low- income and minority populations, groups that are often affected disproportionately in such situations. These sorts of concerns were expressed recently by, among others, researchers Terri Friedline and Mathieu Despard in an article in The Atlantic.See Friedline and Despard. We explored these concerns from the perspectives of those living in existing banking deserts as well as those who are dependent on isolated branches that, if closed, would create new deserts.
Existing Banking Deserts
We followed a prominent study by researchers Don Morgan, Maxim Pinkovskiy and Bryan Yang, published in 2016 by the Federal Reserve Bank of New York, in defining deserts as census tracts in which there are no branches within a 10-mile radius from the tracts’ centers.See Morgan et al. We thank these authors for sharing their data. Our only adjustment was to transform their data using census tract delineations from 2010 rather than 2000. Tracts are classified as “majority minority” if more than 50 percent of their residents are black or Hispanic; they are classified as “lower income” if median household incomes are in the lowest quartile.Household income is the sum of the income of all people 15 years and older living in the household. A household includes related family members and all the unrelated people, if any, such as lodgers, foster children, wards or employees who share the housing unit. A person living alone in a housing unit or a group of unrelated people sharing a housing unit is also counted as a household. The maximum for this quartile is $49,626 in urban areas (inside a metropolitan statistical area or MSA) and $46,095 in rural areas (outside an MSA).
We identified 1,132 deserts in existence at the end of 2014, of which 398 were in urban areas and 734 in rural areas. (See Table 1.) The prevalence of deserts in rural tracts is more pronounced when expressed as percentages of overall tracts: 6 percent rural versus 0.6 percent urban.
| Urban Desert | Other Urban | Rural Desert | Other Rural | |
|---|---|---|---|---|
| Number of Tracts | 398 | 61,175 | 734 | 11,336 |
| Population | 1.53 M | 271 M | 2.21 M | 44.1 M |
| Meridian Income | $62,117 | $66,808 | $54,138 | $54,247 |
| Population in Tracts with Lower Incomes | 0.292 M | 57.8 M | 0.475 M | 10.6 M |
| Median Percentage Minority | 12.8 | 21.2 | 5.9 | 5.9 |
| Population in Tracts with Majority Minorities | 0.265 M | 69.7 M | 0.209 M | 4.2 M |
| SOURCES: 2010 census data, U.S. Census Bureau; authors' calculations. | ||||
Of the 3.74 million people living in these deserts, 291,560 were in urban lower-income tracts and 475,156 were in rural lower-income tracts, while 265,323 were in urban majority-minority tracts and 209,011 were in rural majority-minority tracts.Identifying the numbers of people living in deserts defined by arbitrary geographic boundaries does not offer definitive evidence on all those who may be impacted by limited access to branch services. In this regard, narrower boundaries would increase the number of people considered to be outside the reach of such services. Majority-minority populations were relatively evenly distributed across desert and nondesert tracts in rural areas but, perhaps surprisingly, were less common in urban tracts with deserts than in urban tracts outside deserts.
The foregoing can be expressed from a macroeconomic perspective: The people living in lower-income and majority-minority banking deserts represent, respectively, 0.24 percent and 0.15 percent of the nation’s population. The overlap of both is 0.07 percent. More people live in Huntsville, Ala., than in banking deserts with lower-income and predominantly minority populations.
Potential Banking Deserts
The number of people stranded in areas devoid of bank services would probably expand in the future if branches continue to close. From this perspective, available resources may be better-employed in trying to prevent the creation of more deserts in areas where branches now exist rather than in trying to repopulate existing deserts with new branches.
We isolated branches outside the 10-mile range of any others—that is, branches that if closed would create new banking deserts. Our analysis is based on demographic and economic data collected for the county subdivision in which each branch is located.
We identified 1,055 potential deserts in 2014, of which 204 were in urban areas and 851 in rural areas. The urban areas had a combined population of 2 million, while the rural areas had a combined population of 1.9 million. (See Table 2.) These potential deserts have relatively low population densities of 26 people per square mile in urban areas and 12 people per square mile in rural areas; comparative densities outside potential deserts are, respectively, 176 and 26 people per square mile. Areas with dispersed populations, in other words, are more at risk of becoming a banking desert.
| Urban | Rural | |
|---|---|---|
| Number | 204 | 851 |
| Population | 2.04 M | 1.92 M |
| Population Density | 26 | 12 |
| Median Household Income | $46,717 | $41,259 |
| Median Percentage Minority | 9.8 | 4.0 |
| Median Branch Deposits | $23.1 M | $20.1 M |
| Median Assets of Banks | $776 M | $317 M |
| SOURCES: 2014 branches with deposits data, Competitive Analysis and Structure Source Instrument for Depository Institutions (CASSIDI); 2010 census data, U.S. Census Bureau; authors’ calculations. | ||
| NOTES: “M” denotes millions. Population density is measured as the number of people per square mile. (For urban areas and rural areas outside potential deserts, the comparable densities are 176 and 20.) The data indicate that lower-income households, but not minority households, are more dependent on a last branch, whose closing would create new deserts. | ||
Median incomes are $46,717 in potential urban deserts and $41,259 in potential rural deserts. These levels are lower, respectively, than in existing deserts, as well as in nondeserts (Table 1). This suggests that any desert expansion would affect lower-income people more than higher-income people.
Minorities constitute 9.8 percent of the population in potential urban deserts and 4.0 percent of the population in potential rural deserts. Both percentages are lower than those for existing deserts and nondeserts (Table 1). This suggests that newly created deserts may not disadvantage minorities to a greater extent than existing deserts do.
The Last Branches
Branches in potential deserts are small, with median deposits of $23 million in urban areas and $20 million in rural areas (Table 2). They tend to be operated by small banks, with median total assets of $776 million in urban areas and $317 million in rural areas. In comparison, JP Morgan Chase Bank operates 5,413 branches, with average deposits of $213.4 million and assets valued at more than $2 trillion.
The small size of these branches and the banks that own them suggest that what stands between a community and its isolation within a new banking desert are not the decisions made by big banks with a national footprint but, rather, the decisions made by locally oriented community banks. This contrasts with the large numbers of branch closings by big banks that contributed to the creation of existing deserts as described by Tanya Wolfram in a recent report for a community development organization.See Wolfram.
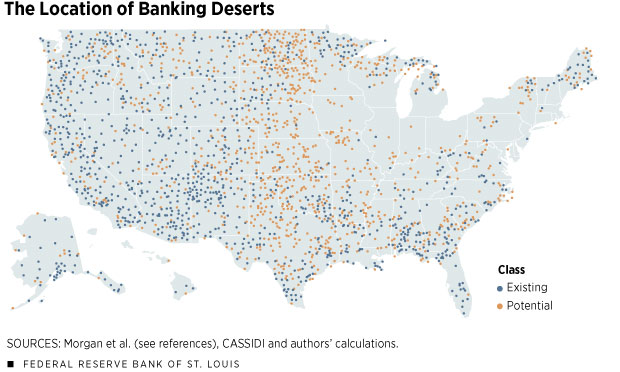
Another difference between existing and potential deserts concerns their geographic distribution. (See map.) Existing deserts tend to be concentrated in Southern and Western states. Potential deserts, on the other hand, are more likely to be located in Midwestern states.
Conclusions
We found that the number of people in deserts that are characterized by lower household incomes and a greater minority presence is relatively modest. We also found that lower-income households, but not minority households, are more dependent on a last branch whose closing would create new deserts. To the extent that these branches are operated by community banks, which have some operational disadvantages relative to larger banks, the most vulnerable people are dependent on the most vulnerable banks.
Endnotes
- See Friedline and Despard.
- See Morgan et al. We thank these authors for sharing their data. Our only adjustment was to transform their data using census tract delineations from 2010 rather than 2000.
- Household income is the sum of the income of all people 15 years and older living in the household. A household includes related family members and all the unrelated people, if any, such as lodgers, foster children, wards or employees who share the housing unit. A person living alone in a housing unit or a group of unrelated people sharing a housing unit is also counted as a household.
- Identifying the numbers of people living in deserts defined by arbitrary geographic boundaries does not offer definitive evidence on all those who may be impacted by limited access to branch services. In this regard, narrower boundaries would increase the number of people considered to be outside the reach of such services.
- See Wolfram.
References
Despard, Mathieu; and Friedline, Terri. Life in a Banking Desert. The Atlantic. March 13, 2016.
Morgan, Don; Pinkovskiy, Maxim; and Yang, Bryan. Banking Deserts, Branch Closings and Soft Information. Liberty Street Economics, Federal Reserve Bank of New York, July 12, 2016.
Wolfram, Tanya. The Last Bank in Town: Branch Closures in Rural Communities (PDF). Reinvestment Partners.


Views expressed in Regional Economist are not necessarily those of the St. Louis Fed or Federal Reserve System.
For the latest insights from our economists and other St. Louis Fed experts, visit On the Economy and subscribe.
Email Us