Looking at Recessions through a Different Lens
A recession can be many things to many people, and this is precisely the insight of new research from economists Fatih Guvenen, Serdar Ozkan and Jae Song. Though the point seems trivial, their focus on differential impacts in the discussion of business cycles is relatively new. The Keynesian tradition described recessions in terms of declines in aggregate demand, analyzing the movement of statistics that describe the economy as a whole. Most of macroeconomic thinking followed suit. For instance, a recession came to be defined roughly as anytime that gross domestic product (GDP) declines for two consecutive quarters. But what is happening under the surface to the individuals who make up aggregate demand, those whose individual incomes comprise GDP?
Ten years ago, Kjetil Storesletten, Chris Telmer and Amir Yaron estimated in an influential paper that recessions had a very large and disparate impact on those who live through them; people's income trajectories diverge almost three times as much as during good times. Following from this and other related research, there is a popular conception that (a) recessions are times when the variance of earnings changes increases—some income trajectories fall more and others rise more than during periods of stable growth, and (b) these shocks affect the bottom 99 percent of the population much more than the top 1 percent of earners. However, the research this year by Guvenen, Ozkan and Song challenges both of these perceptions. Using far-more complete data than was previously available, the authors found instead that (a) it is the skewness of labor income that is affected during recessions—some people experience very large, negative changes, but fewer are set on positive trajectories, and (b) the highest earners are, by some measures, the most affected by recessions.
In the past, most of the important research on the volatility of individuals' earnings has used data from self-reported income in relatively small surveys. This type of data has a number of drawbacks. Most obviously, the income is self-reported, hence, subject to respondent-side error. Also, because the surveys are relatively small, estimates made from even smaller subsets of this data are more prone to errors. More-recent research studies have used new, more precise data from either income tax or Social Security databases. This type of administrative data in the U.S. is largely free of reporting error; furthermore, given the very large sample sizes, the data can be divided into innumerable subsets without seriously compromising the accuracy of estimates.
In this article, we focus primarily on research from Guvenen, Ozkan and Song about earnings risk using Social Security data on individual earnings histories. In particular, we look at how recessions affect the distribution of changes to earnings.
During recessions, there are more earnings losses than during good times, i.e., the distribution skews downward. These income losses are even more likely among the prerecession poor. On the other side of the distribution, high earners also experience recessions strongly, as the fraction of earnings lost by someone in the top 1 percent is as much as double the percentage loss of the average worker. We also look at how these trends have changed in different recessions since the early 1980s.
Earnings Risk
Earnings risk refers to unanticipated changes in one's earnings, what are often called "shocks" in economists' jargon. People may be laid off or promoted, or their earnings are simply not adjusted to keep up with inflation. We say risk rises when these changes spread out, when there are fewer people with stable incomes and when more people experience very positive or very negative changes; statistically, an increase in risk can correspond to an increase in the variance of changes.
Earnings risks are ever present, but recessions are times when the unemployment rate rises, fewer people switch to better-paying jobs1 and recent college graduates have more difficulty finding good jobs.2 What do these qualitative facts do quantitatively to risk during recessions? On average, shocks are negative and, further, shocks are skewed downward in recessions. Risk increases—and much more to the downside.
Recessions: Harsher on the Poor
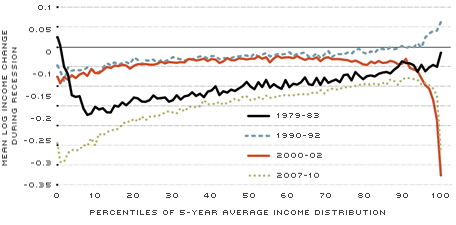
During a recession, the earnings of the average poor worker fall by a larger extent than the earnings of the average middle-class worker. Of course, the average income falls during a recession, but what is the distribution of these declines across prior levels of income? Those who were poorest during the prerecession years suffer the largest percentage decline in their income during a recession. In contrast, the picture improves steadily for those groups with larger prerecession incomes until we consider the very top of the earnings distribution. For those in the uppermost income ranges, their earnings decline relatively steeply during the recession. These trends for four recent recessions are presented graphically in Figure 1, taken from Guvenen, Ozkan and Song. The figure groups people into categories according to their average earnings during the five years before a recession and then looks at what is the average earnings decline of that group.
Notice in Figure 1 that the most pronounced differences occur during the most severe recessions: The double-dip recession in the early 1980s and the Great Recession of the late 2000s were hardest on the poor. Those with low earnings going into these recessions had, on average, the largest earnings losses during the recessions.
More Downside than Upside
The skew of earnings risk is also an important feature of recessions, meaning that these are times when downside risk is more prevalent than upside. If recessions were simply times during which earnings risk rises, i.e., times when the variance of changes to earnings increases, then the number of people with positive and with negative changes may be roughly symmetric. But recessions bring about more layoffs and fewer promotions. Recessions are times when negotiating for a wage increase is more difficult and when firms are under pressure to cut costs, including in their wage bill. The workers affected by a recession are much more likely to experience drops in their earnings than rises. Statistically, this is described as "skewness," the distribution of earnings changes is skewed downward.
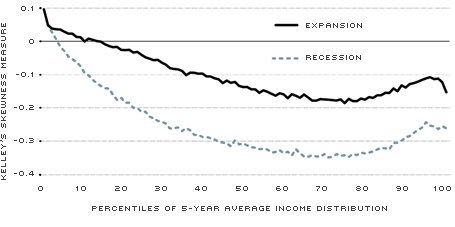
Figure 2, again from Guvenen, Ozkan and Song, plots a measure of skewness of changes in labor income. As before, the authors group people by their income prior to the recession so that the prerecession poor are on the left side and rich on the right. Then for each of these groups, the skewness presents how much more downside risk than upside risk there is for that group. In the figure, most of the values are negative, meaning that next year's change in earnings is more likely to be negative than the median change, which has been notably stable over the cycle.3
Top Earnings
As could be seen from Figure 1, the far right of the earnings distribution, the top 1 percent, had markedly larger average falls in earnings during the last two recessions than other income groups, the 90th percentile for example. Indeed, the highest earners seemed to have broken the otherwise-strong pattern that recessions have a larger average effect on the poor.
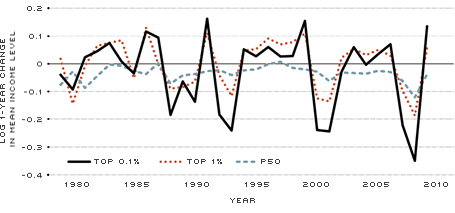
Figure 3 explores this observation even further. During 2008, the worst year of the Great Recession, the average fall in earnings among the top 1 percent was about twice as large as the fall of the median earner, shown at P50 (50th percentile) in the figure. As a percentage of their earnings, the top 0.1 percent experienced an even larger fall than the top 1 percent. The very rich also felt the prior recession quite a bit more strongly than the median earner, though this pattern dissipated in earlier cycles.
We also see in Figure 3 that the earnings of the top 1 percent are becoming more cyclical and volatile since the 1980s, which is not inconsistent with earlier evidence4 using tax data. Tax data allowed researchers to see the total incomes of the very rich and showed that both labor and nonlabor income among the very rich were becoming more sensitive to recessions. However, with tax data, the unit of observation was a tax unit; the data might have been affected by changes in the size of households and the choice to file jointly or individually.
The picture painted by Guvenen, Ozkan and Song also nicely complements the findings of other researchers, including Thomas Piketty and Emmanuel Saez, who presented long-term data on the rise in the earnings of the top 1 percent. As seen in Figure 3, in expansions, the richest groups gained quite a bit, even as median incomes rose little. So, while the declines in earnings among the richest were quite large during recessions, their gains during good times more than made up for their recession losses.
The historical comparison in Figure 3 between the early 1980s recession and theGreat Recession is also quite instructive. According to the more recent updates to data in Piketty and Saez, the share of income going to the top 1 percent increased from about 10 percent in the early 1980s to about 25 percent just before the Great Recession. But these gains were not evidently protected from the Great Recession; they were actually more affected by this cycle.
Even as there are great changes happening to the distribution of earnings, there are similarly great changes occurring in the distribution of earnings risk, and we are only just beginning to learn about them.

Click to enlarge [back to text]
SOURCES: Social Security Administration and economists Guvenen, Ozkan and Song.
The mean log change on the vertical axis is approximately the percentage change in income over one year. Along the horizontal axis, individuals are ranked according to their earnings prior to the recession. Thus, along the left of the figure, we see the average amount that earnings fell for those who were relatively poor prior to the recession and along the right we see the average fall of the relatively rich.

Click to enlarge [back to text]
SOURCES: Social Security Administration and economists Guvenen, Ozkan and Song.
The vertical axis measures the skewness of earnings changes, and negative numbers indicate a long tail of large falls in earnings. (The particular measure on the vertical axis is called Kelley's measure of skewness. It tells what fraction the top or the bottom tail explain of the difference between the 90th and 10th percentiles of the change distribution. A value of –0.1 means that the bottom tail, the median minus the 10th percentile, explains 10 percent of the difference in the 90th and 10th percentiles.) Along the horizontal axis, people are ranked according to their earnings prior to the recession, and at almost all of the levels their changes were skewed downward: There were more large falls in earnings than rises.

Click to enlarge [back to text]
SOURCES: Social Security Administration and economists Guvenen, Ozkan and Song.
The mean log change on the vertical axis is approximately the percentage change in income over one year. We see that, relative to the median earner, shown by P50 (50th percentile), the higher earnings groups had more volatile earnings and larger falls, especially during the past two recessions.
Endnotes
- See Carrillo-Tudela et al. [back to text]
- See Kahn. [back to text]
- The particular measure on the vertical axis is called Kelley's measure of skewness. It tells what fraction the top or the bottom tail explain of the difference between the 90th and 10th percentiles of the change distribution. A value of –0.1 means that the bottom tail, the median minus the 10th percentile, explains 10 percent of the difference in the 90th and 10th percentiles. [back to text]
- See Parker and Vissing-Jorgensen.[back to text]
References
Carrillo-Tudela, Carlos; Hobijn, Bart; She, Powen; and Visschers, Ludo. "The Extent and Cyclicality of Career Changes: Evidence for the U.K." Institut zur Zukunft der Arbeit (Institute for the Study of Labor) Discussion Paper No. 8430, 2014.
Guvenen, Fatih; Ozkan, Serdar; and Song, Jae. "The Nature of Countercyclical Income Risk." Journal of Political Economy, 2014, Vol. 122, No. 3, pp. 621-60.
Kahn, Lisa. "The Long-Term Labor Market Consequences of Graduating from College in a Bad Economy." Labor Economics, 2010, Vol. 17, No. 2, pp. 303-16.
Parker, Jonathan A.; and Vissing-Jorgensen, Annette. "The Increase in Income Cyclicality of High-Income Households and Its Relation to the Rise in Top Income Shares." National Bureau of Economic Research Working Paper No. 16577, 2010.
Piketty, Thomas; and Saez, Emmanuel. "Income Inequality in the United States, 1913-1998." Quarterly Journal of Economics, February 2003, Vol. 118, No. 1, pp. 1-39.
Storesletten, Kjetil; Telmer, Chris; and Yaron, Amir. "Cyclical Dynamics in Idiosyncratic Labor-Market Risk." Journal of Political Economy, 2004, Vol. 112, No. 3, pp. 695-717.
Views expressed in Regional Economist are not necessarily those of the St. Louis Fed or Federal Reserve System.
For the latest insights from our economists and other St. Louis Fed experts, visit On the Economy and subscribe.
Email Us

