


Food Prices and Inflation in China and the U.S. Are Following Similar Paths
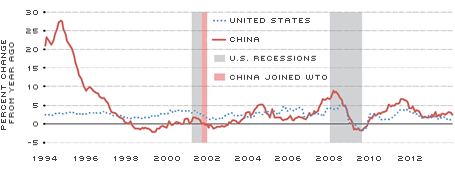
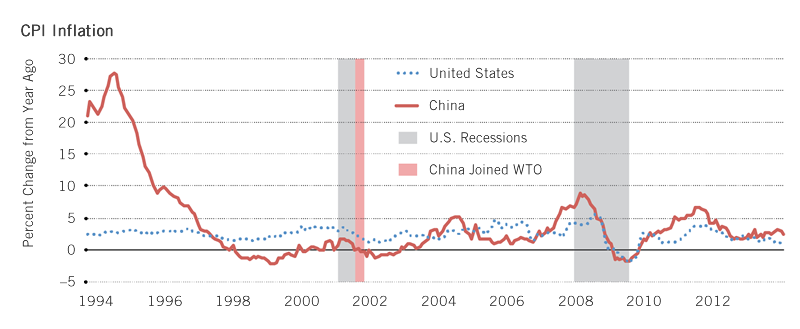
Inflation, as measured by growth in the consumer price index (CPI), has been relatively stable during the past two years in both the U.S. and China. Both countries also shared a period of price volatility in the years before and after the Great Recession—a time when commodity prices were fluctuating around the globe. Before 2000, however, prices in China and the U.S. did not always behave similarly. (See Figure 1.)
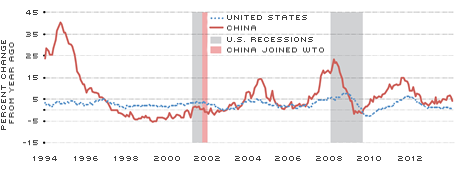
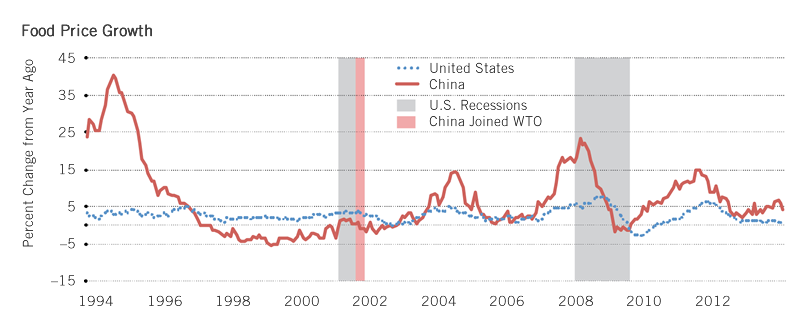
Food prices, an important component in the CPI, can help explain the relationship between the two countries' overall price co-movements. Fluctuations in food prices in China started to become more strongly correlated to those in the U.S. after China joined the World Trade Organization (WTO) in 2001. Between 1994 and 2001, the correlation1 was 41 percent; between 2002 and 2013, it rose to 62 percent. (See Figure 2 and the table.)
But what drives the co-movement in food prices of the two countries? Are there explanations other than this co-movement for the increased synchronization of inflation in China and the U.S.? Let's look at some possible answers to these questions.
World Food and Commodity Prices
Some people think that prices in general and food prices in particular are highly correlated in the U.S. and China because both sets of prices are affected by some worldwide factors, such as movements in world food prices. Data show that this is true for China, but not for the U.S.
China's food prices were strongly correlated with world food prices between 2002 and 2013 (80 percent correlation), while U.S. food prices during the same period were not that highly correlated to world food prices (34 percent). Similarly, Chinese food prices were strongly and significantly correlated with the S&P Goldman Sachs Commodity Index between 2002 and 2013 (49 percent), while the correlation between U.S. food prices and the S&P GSCI was low (10 percent) and not statistically significant.
Exchange Rates and Money Supply
Looking at food prices from a monetary standpoint, another likely explanation could be related to currency exchange rates. China has a targeted floating exchange rate with the dollar; so, higher money supply in the U.S. should lead to higher money supply in China. If this were true, CPI inflation in China and the U.S. should fluctuate in similar patterns.2
The data are not conclusive regarding this explanation. The correlation between CPI inflation in the U.S. and China more than doubled, from 24 percent between 1994 and 2001 to 57 percent between 2002 and 2013. But the correlation between M1 money supply in the U.S. and China is negative, and it weakened from –59 percent between 1994 and 2001 to –28 percent between 2002 and 2013. Moreover, there has not been any significant shift in monetary and exchange rate policy toward closer policy coordination. If anything, China has relaxed the yuan's link to the U.S. dollar in recent years.
Agricultural Trade Volumes
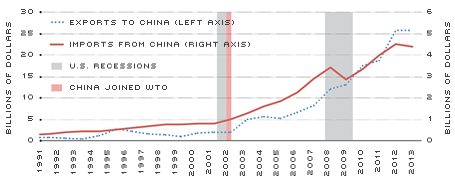
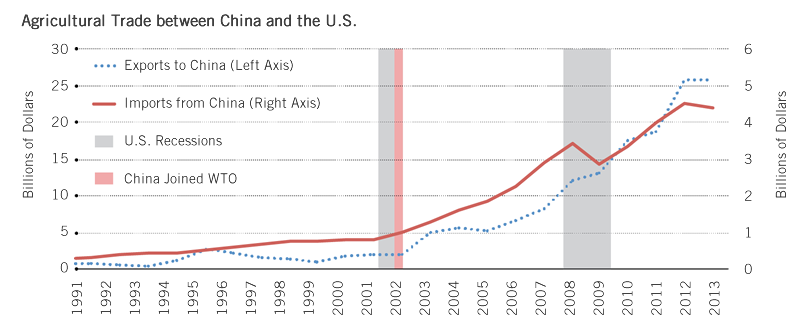
Given that the price correlations are markedly stronger after China joined the WTO, and since the other two possible explanations are not very conclusive, the structural change can likely be explained by the strong increase in trade, particularly agricultural trade, between China and the U.S. From 1991 until 2001, when China joined the WTO, agricultural exports from the U.S. to China grew 168 percent and agricultural imports grew 146 percent. During the 10 years after China joined the WTO, agricultural exports from the U.S. to China and imports from China to the U.S. grew 874 percent and 388 percent, respectively. (See Figure 3.)
In 2013 alone, about 18 percent of total U.S. agricultural exports went to China ($25.9 billion), including $13.4 billion in soybeans, $4.7 billion in grain and feed cereal, $3.7 billion in livestock and animal products, and $2.2 billion in cotton.
However, only about 4 percent of U.S. agricultural imports in 2013 came from China ($4.4 billion), including $1.7 billion in fruit and vegetable products, $0.6 billion in livestock and animal products, and $0.5 billion in grain and feed cereal, in addition to $2.7 billion of fish (which is considered a nonagricultural commodity).
Soybean trade is particularly interesting. International prices for soybeans are highly correlated with food prices around the world. The correlations strengthened after 2002 for China, the U.S. and the entire world.3 (See the table.) Since the early 2000s, soybeans have accounted for 40 to 60 percent of U.S. agricultural exports to China, peaking at 70 percent in 2009. Soybeans drove most of the surge in agricultural trade between both countries after 2002.
Intersecting Needs
Agricultural trade between China and the U.S.—the two largest economies in the world—is substantial and has been increasing rapidly and steadily, making not only China's food prices sensitive to those in the U.S., but also vice versa. Urbanization and higher incomes have helped shift Chinese people toward more protein-based diets, thus fueling demand for feed cereal and livestock and putting upward pressure on U.S. agricultural products. The heavy reliance by Americans on consumer goods from China may also make the U.S. cost of living sensitive to that in China, and Chinese production costs, especially wages, have been rising rapidly in recent years. Such developments can only imply stronger cross-country correlations in food prices and CPI inflation between the two countries.
CPI Inflation
Click to enlarge [back to text]
SOURCES: Organization for Economic Cooperation and Development, Federal Reserve Economic Data (FRED).
Food Price Growth
Click to enlarge [back to text]
SOURCES: Organization for Economic Cooperation and Development, Federal Reserve Economic Data (FRED).
Agricultural Trade between China and the U.S.
Click to enlarge [back to text]
SOURCES: U.S. Census Bureau, U.S. Department of Agriculture Foreign Agricultural Service.
Endnotes
- Correlation is a measure of the statistical relationship between two random variables. If they are perfectly synchronized in movements, the correlation is 1; if they have no relationship or similarities at all, then the correlation is 0. [back to text]
- If the money supply in the U.S. increases, there is more money chasing the same amount of goods, putting upward pressure on U.S. prices. Therefore, China's money supply has to increase in order to maintain the same exchange rate level, which should also lead to higher prices in China. Throughout this article, we use M1 money stock as a measure of the money supply; M1 includes notes and coins in circulation, traveler's checks, demand deposits and checkable deposits. [back to text]
- Even though U.S. food prices are not as highly correlated with international soybean prices, the correlation strengthened in the period after 2002. [back to text]


Views expressed in Regional Economist are not necessarily those of the St. Louis Fed or Federal Reserve System.
For the latest insights from our economists and other St. Louis Fed experts, visit On the Economy and subscribe.
Email Us