


District Overview: Buying Power of Minimum Wage Varies across and within States
In his 2014 State of the Union address, President Obama called on Congress to raise the federal minimum wage to $10.10 from $7.25. Soon after, states and cities began to act on their own. Connecticut became the first state to respond by increasing its minimum wage to $10.10, which will take effect in 2017. In Seattle, city lawmakers passed a $15 minimum wage bill, also to go into effect in 2017.
Although only 4.3 percent of all hourly paid workers earned the federal minimum wage or less1 in 2013, 2 raising the minimum wage seems to be a topic that garners a lot of interest from citizens in every income bracket. The debate about the effects of the minimum wage is ongoing; lawmakers consider the impact that a change in the minimum wage will have on businesses, unemployment, worker productivity and the financial well-being of those employees who receive the minimum wage. Although there are many facets of this debate, this article will focus on how the varying cost of living across and within states affects the buying power of workers earning the minimum wage.
From 1998 to 2007, the federal minimum wage remained fixed at $5.15. During this period, many states thought they would be better off—either because of the cost of living or for political ideological reasons—with a higher minimum wage. By 2007, there were 29 states with a minimum wage above the federal limit.3 In subsequent years, the federal minimum wage increased incrementally—to $7.25 from $5.15 by the end of 2009—and surpassed many of the state minimums that had previously risen above it.
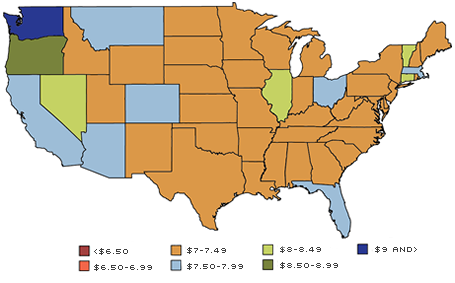
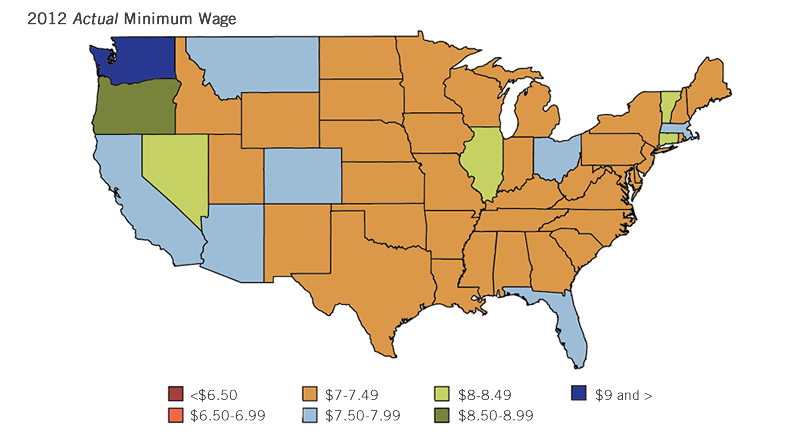
The federal minimum wage has been unchanged since the end of 2009. States have again begun to raise their minimums above the federal limit. In 2012, there were 18 states with minimum wages above the federal rate, up from 12 in 2009. The states with minimum wages at least a dollar greater than the federal minimum wage in 2012 were Washington ($9.04), Oregon ($8.80), Vermont ($8.46), and Connecticut, Illinois and Nevada ($8.25).4
Cost-of-Living Differences across States
One of the motivations to have differing minimum wages is to adjust for cost of living, which varies widely throughout the country. The Bureau of Economic Analysis (BEA) developed regional price parities (RPPs), which measure differences in the price levels of goods and services across state and metropolitan areas. The national price level is indexed to 100, and the individual state and metro-area RPPs are expressed as a percentage of the national price level. In 2012, Hawaii had the highest cost of living with an RPP of 117.2, meaning the cost of living in Hawaii was 17.2 percent higher than the national average. Hawaii was followed by New York, New Jersey and California as states with the highest cost of living. The state with the lowest cost of living was Mississippi, with an RPP of 86.4, meaning the cost of living in Mississippi was 13.6 percent less than the national average. Mississippi was followed by Arkansas, Alabama and Missouri as states with the lowest cost of living.5
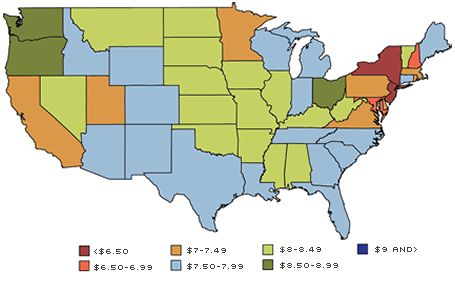
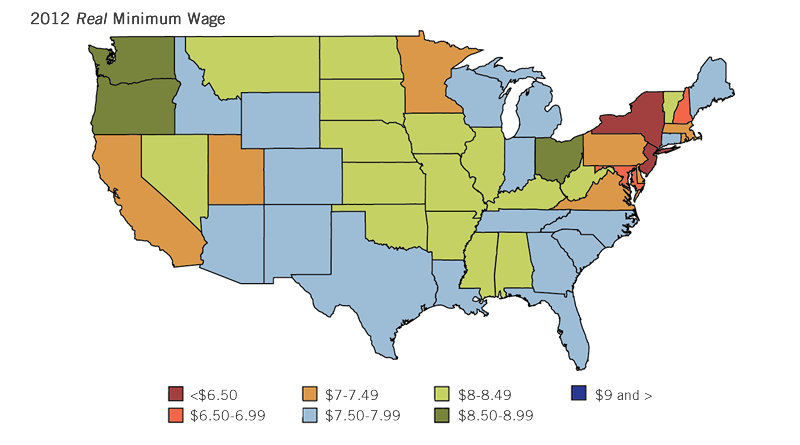
Adjusting each state's minimum wage using its RPP is a measure of the "real" minimum wage, or the minimum wage after accounting for cost of living. The states with the highest RPP-adjusted minimum wages, or real minimum wages, were Oregon ($8.91), Washington ($8.76), Ohio ($8.63), Nevada ($8.40) and Mississippi ($8.39). Mississippi, notably, had the lowest possible minimum wage (the federal minimum wage) but still had the fifth-highest real minimum wage because of the low cost of living. The states with the lowest real minimum wages were Hawaii ($6.19), New York ($6.28) and New Jersey ($6.35), all of which had minimum wages equal to the federal minimum in 2012. Other notable differences appear in Connecticut, which was tied for the fourth-highest minimum wage but had a below-average real minimum wage, and California, which was tied for the seventh-highest minimum wage but had the seventh-lowest real minimum wage. If the target for each state was to have a real minimum wage equal to the federal minimum wage of $7.25, then Mississippi would set the minimum wage at $6.26, while Hawaii would set the minimum wage at $8.50.
Cost-of-Living Differences within States
Although most minimum wages are set at the state level, cost-of-living discrepancies also occur within states, skewing the purchasing power of workers within a state. For example, the RPP of the Chicago and Danville metropolitan statistical areas (MSAs), the highest- and lowest-cost-of-living MSAs in Illinois, were 106.6 and 79.4, respectively. Given Illinois' minimum wage of $8.25, the purchasing power of a Chicago minimum-wage earner is $7.74, while the purchasing power of a Danville minimum-wage earner is $10.39. Chicago would need to set its minimum wage to $11.08 if it wanted its minimum-wage earners to have the same purchasing power as the minimum-wage workers in Danville. In California, which had an $8 minimum wage in 2012, the highest-cost-of-living MSA, San Jose-Sunnyvale-Santa Clara, had a real minimum wage of $6.56, while the lowest-cost-of-living MSA, El Centro, had a real minimum wage of $8.68.
In order to address the cost-of-living variances within states, some cities have set their own minimum wages. In 2013, San Jose's new minimum wage law came into effect, raising the city's minimum wage to $10 an hour, $2 above the state minimum. This translated to a real minimum wage of $8.20,6 still 48 cents below the real minimum wage of El Centro. Although minimum-wage increases like these compensate for cost-of-living differences, there are some concerns that varying minimum wages within a state could have adverse effects. Recently, Oklahoma created a state law forbidding cities from raising their minimum wage above the state minimum out of fear that it would cause businesses to flock to cities with lower minimum wages and harm communities elsewhere.
The Eighth District
Turning to the seven states that make up the Eighth District, Illinois was the only state with a minimum wage above the federal minimum in 2012. However, due to the low cost of living, the states within the Eighth District rank in the upper half in terms of real minimum wage: Mississippi—$8.39, fifth in the country; Arkansas—$8.28, seventh; Missouri—$8.23, eighth; Illinois—$8.20, 11th; Kentucky—$8.16, 13th; Tennessee—$7.99, 20th; and Indiana—$7.96, 22nd.
The largest MSAs of the Eighth District also have real minimum wages considerably higher than the federal minimum wage. In 2012, the real minimum wages of the four largest MSAs in the district were St. Louis ($8.16), Louisville ($7.98), Little Rock ($7.96) and Memphis ($7.87). The MSA in the Eighth District with the highest real minimum wage was Carbondale-Marion, Ill., at $9.81. This is due to both the high minimum wage in Illinois and the relatively low cost of living in southern Illinois. The lowest real minimum wage in the district was in Columbia, Mo., at $7.86, still 61 cents above the federal minimum wage.
Revisiting Seattle and Connecticut
Using RPPs, we can estimate what the real minimum wages of Connecticut and Seattle will be in 2017, the year their new laws are fully enacted. After factoring in inflation and cost of living, the Seattle real minimum wage will be about $12.72, while the Connecticut real minimum wage will be about $8.37.7 Many more states and cities have crafted new minimum-wage legislation, and it will be interesting to see how these new minimum wages, along with changes in cost of living, affect the real minimum-wage picture going forward.
2012 Actual Minimum Wage
SOURCE: U.S. Department of Labor.
NOTE: The actual minimum wage is what the law called for in that state as of 2012. The real minimum wage accounts for the cost of living in a state, given that it's often higher or lower than a national average. The real wage shows the buying power of the minimum wage in that state. The real wage is calculated using regional price parities (RPPs). These measure differences in the price levels of goods and services across states. Although not shown on these maps, RPPs are also available for metro- politan areas. The minimum wages (actual, real) in Alaska ($7.75, $7.24) and Hawaii ($7.25, $6.19) are not shown in the maps.
2012 Real Minimum Wage
SOURCES: U.S. Bureau of Economic Analysis, Department of Labor and author's calculations.
Endnotes
- Although minimum wage laws apply to almost everyone, they do not apply to tipped employees, full-time students or employees of enterprises that have annual gross volume of sales or business below $500,000. [back to text]
- See www.bls.gov/cps/minwage2013.pdf. [back to text]
- Minimum-wage law is structured so that if the federal, state or municipal minimum wages differ, then the worker receives the largest of the conflicting minimum wages. [back to text]
- If a state sets a lower minimum wage for small businesses, I ignored that lower minimum wage and used the higher one since the majority of minimum-wage workers are employed by medium or large businesses. [back to text]
- The regional price parity numbers for 2013 were not available at the time this article was written; so, the 2012 numbers were used. [back to text]
- Using 2012's Regional Price Parity number. [back to text]
- For inflation, I used the 5-year expected inflation rate for the nation as of July 23, 2014. Let i=inflation, MW=2017 minimum wage, RPP=2012 RPP and RMW=real minimum wage in 2017 in 2012 dollars.
 Click to enlarge [back to text]

Views expressed in Regional Economist are not necessarily those of the St. Louis Fed or Federal Reserve System.
For the latest insights from our economists and other St. Louis Fed experts, visit On the Economy and subscribe.
Email Us