Higher Taxes for Top Earners: Can They Really Increase Revenue?
Are top-income households paying enough taxes?
Increasing top income-tax rates in the U.S. would result in larger government revenue, according to a 2011 academic study by Peter Diamond, winner of the Nobel Prize for economics in 2010, and by Emmanuel Saez, winner of the John Bates Clark Medal in 2009.1 Their study argues that households in the top 1 percent of income distribution should pay a marginal tax rate in the range of 54-80 percent. Such a rate would be substantially higher than the current one, which is approximately 42.5 percent.2
The Diamond-Saez proposal has fueled a debate in the blogosphere, in academic circles and in Washington, D.C. One of the reasons is that top income-tax rates of this magnitude can be popular among many voters and, therefore, could become a reality in the future. Recently in France, presidential candidate Francois Hollande promised a 75 percent top income-tax rate during his campaign in order to attract left-wing voters and, according to The Economist, made this tax rate a centerpiece of his budget program.3 Perhaps aided by this promise, Hollande became the first left-wing president of France since Francois Mitterrand (who served from 1981 to 1995). However, the top-tax reform was ultimately rejected by the French parliament near the end of last year.
In spite of all the discussion, few people understand the calculations behind the Diamond-Saez recommendation. This article provides a quick introduction to their calculations and concludes with a brief description of some factors that may be important for discussing their recommendation.
The Facts behind the Calculations
First, in the U.S., a household is in the top 1 percent of the income distribution if its income is, roughly, above $400,000 per year. That means that the proposed top marginal income-tax rate would apply only to income accrued beyond $400,000. Income up to that level would be taxed at rates for lower income levels.
Second, the average household in the top 1 percent of the income distribution makes approximately $1.3 million per year. This means that on a per household basis, $900,000 (that is, $1.3 million minus $400,000) of the income would be subject to the proposed top marginal income tax.
Third, the net-of-tax rate is defined as the percentage of income earned beyond $400,000 that the household can keep after taxes. If the top income-tax rate is 42 percent, the net-of-tax rate would simply be 58 percent (that is, 100 minus 42 percent). Researchers estimate that when the net-of-tax rate falls by 1 percent, top-income households react by reducing their reported income by a fraction e, where e is between 0.17 and 0.57 (that is, between 17 and 57 percent).
These estimates are based on information collected over a few years after a tax reform. Unfortunately, there is no direct evidence of what happens with reported incomes over a longer time horizon.
The reaction of reported income to higher taxes is called the "short-run behavioral response" of the household, and it occurs partly because higher taxes lead high-income persons to work fewer hours per year. Technically, e is called the elasticity of reported income with respect to the net-of-tax rate.
With these facts in hand, suppose that the government is considering increasing the top income-tax rate from its current level, say, by 1 percentage point. Diamond and Saez take into account two effects of this increase on government tax revenue. The first effect increases revenue, and the second decreases revenue.
First, tax revenue is going to increase because top-income households are taxed more heavily. Keeping everything else constant, the increase in the revenue extracted from each top-income household would be exactly equal to 1 percent of $900,000, that is, $9,000 per household.
Second, Diamond and Saez consider the short-run behavioral response. As the tax rate is increased by 1 percentage point, the net-of-tax rate decreases by a certain percentage, and households react to this by decreasing their income. This reduction causes a fall in government revenue simply because less than $900,000 would be effectively taxed per household. This reduction is known as the "deadweight loss" from taxation. Diamond and Saez use the estimated behavioral responses that we cite above in order to calculate the magnitude of the reduction in income by top-income households when tax rates go up.
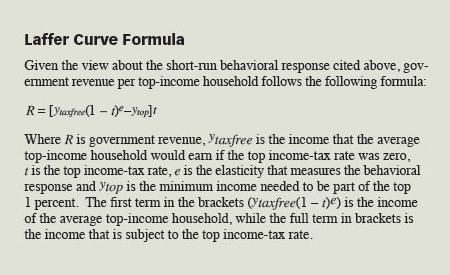
Whether increasing taxes would lead to more revenue will depend on which of the two effects is stronger. If the first effect is stronger, the government can increase revenue by increasing taxes. If the deadweight loss is stronger, then the government could raise more revenue by decreasing taxes. Intuitively, the first effect is stronger when the tax rate is low, while at high tax rates the behavioral response dominates.4 Therefore, government revenue would increase at low tax rates and decrease at high tax rates. This leads to a bell-shaped plot known as the Laffer Curve, which relates tax rates to government revenue. A formula for the Laffer Curve considered by Diamond and Saez is given in the box below.
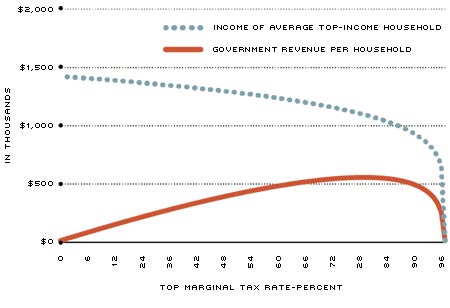
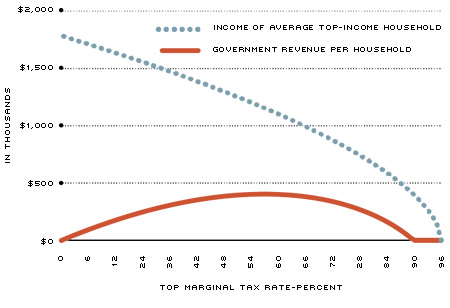
Panels A and B plot the income of the average top-income household and the Laffer Curve considered by Diamond and Saez for two values of e.5 The blue dotted line in each panel of the figure shows how the income of the average top-income household falls as the tax rate increases. Panel A has a lower value of e, which implies that the behavioral response is smaller; so, income falls more slowly than in Panel B, where the value of e is higher. The red solid line shows the Laffer Curve, which simply plots revenue (R, from the formula in the box) as a function of the tax rate (t in the box). As expected, tax revenue increases when the tax rate is low and decreases when the tax rate is high.

Visually, the reader can verify that with a behavioral response of e=0.17, the top of the Laffer Curve is reached when the top-income tax is about 80 percent. With a behavioral response of e=0.57 instead of e=0.17, meaning that the household reduces its reported income more dramatically when taxes go up, the tax rate that maximizes government revenue is about 55 percent.
In summary, we have explained how Diamond and Saez make their case for higher top-income tax rates in the U.S. Using current tax rates, facts about U.S. income distribution and estimates of the response of households to tax changes, Diamond and Saez have produced an argument in favor of the idea that the revenue-increasing effect of increasing the top income-tax rate is greater than the associated deadweight loss. Given the clarity of their argument, their calculation can be used as a starting point for asking crucial questions about tax policy in the U.S. For example:
(i) The behavioral response used by Diamond and Saez is measured only over a few years after a tax reform. Can the behavioral response be larger over longer periods of time? This can happen, for example, if bright young people reduce their schooling today anticipating that they will be heavily taxed if they become top-income earners tomorrow.
(ii) Diamond and Saez assume that the number of households with income above $400,000 per year remains fixed after the tax reform. How many households would drop out of the top-income bracket (either through migrating to another country or simply by making less than $400,000) in response to the reform?
(iii) In the Diamond-Saez calculation, only households in the top 1 percent are affected by the reform. Are there households outside of the top 1 percent indirectly affected by the reform? One case in which this happens is when high-income persons have positive externalities on the rest of society. For example, consider the way in which the invention of smartphones has created new markets for software applications and music files. These ideas may have been lost if these inventors had been discouraged by very high tax rates on those making top incomes.
Income and Laffer Curve with e=0.17

Income and Laffer Curve with e=0.57

SOURCES: Author's calculations.
NOTES: The blue dotted line in each panel of the figure shows how the income of the average top-income household falls as the tax rate increases. In both figures, the income has been set to be $1.3 million when the tax rate is at 42.5 percent, which is the top tax rate now in the U.S. If the tax rate rises to, say, 80 percent, income in Panel A falls to approximately $1.2 million, while in Panel B it falls to about $700,000. The larger fall in Panel B reflects the fact that the behavioral response has been set higher (57 percent) in Panel B than in Panel A (17 percent). The solid line in each panel shows how government revenue per top-income household changes as the tax rate changes. This line is, thus, the Laffer Curve for top incomes. Again, at the U.S. tax rate of 42.5 percent, revenue is the same in both panels at approximately $380,000. (This follows because at that tax rate, taxable income and tax rates are the same across the two panels.)
Endnotes
- See Diamond and Saez. [back to text]
- Diamond and Saez show that if one combines federal and state income taxes, along with other taxes (such as Medicare and sales taxes), the marginal tax rate currently paid by a top-income household in the U.S. is approximately 42.5 percent. [back to text]
- See Yaitsky. [back to text]
- Clearly, if the tax rate is 0 percent, the government will raise more revenue by increasing the tax rate. Also, if the tax rate is 100 percent, no one would work; so, revenue would be zero, and the government would raise more revenue by reducing the tax rate. Therefore, the revenue-maximizing tax rate should be somewhere between 0 and 100 percent. [back to text]
- In each of the plots, we pick the value of ytaxfree so that the income of the average top-income households is $1.3 million when the top-income tax rate is 42.5 percent, as it is in the United States. We also fix the value of ytop=$400,000, as in the United States. [back to text]
References
Diamond, Peter; and Saez, Emmanuel. "The Case for a Progressive Tax: From Basic Research to Policy Recommendations." Journal of Economic Perspectives, Vol. 25, No. 4, Fall 2011, pp. 165-190.
Yaitsky, Eduard. "French Taxation: À Bas les Riches!" The Economist, Jan. 5, 2013.
Views expressed in Regional Economist are not necessarily those of the St. Louis Fed or Federal Reserve System.
For the latest insights from our economists and other St. Louis Fed experts, visit On the Economy and subscribe.
Email Us

