


A Closer Look at the Decline in the Labor Force Participation Rate
The aggregate labor force participation (LFP) rate measures the share of the civilian, noninstitutionalized population that is either employed or unemployed but looking for work. The LFP rate reached its peak of 67.1 percent in 2000 and has been declining ever since. Between the first quarter of 2008 and the first quarter of 2013, the LFP rate dropped from 65.6 percent to 63.2 percent. The decline accelerated during the Great Recession, raising the question: Does the low LFP rate in 2013 reflect negative cyclical influences, or does it reflect the trend of a long-run decline in the LFP?1 The question is important: If a large portion of the workers who are currently out of the labor force is out because of cyclical influences, then the unemployment rate might not be fully capturing the slack in the labor market.
The Bureau of Labor Statistics (BLS) periodically releases its medium- and long-term projections of the labor force.2 For this article, we reviewed the most recent BLS projections of the LFP rate and other BLS projections released since 2000. We learned that, since 2000, the BLS has been projecting a long-term decline in the aggregate LFP rate, with various possible magnitudes of the decline.
It is tempting to interpret the prerecession projections as reflecting the long-term trend in the LFP rate. However, we observed that the BLS' projections did not necessarily capture the long-term trend; rather, to a substantial degree, they were influenced by the most recent data points. Consequently, this cautions against treating the difference between the actual LFP rate in 2012 and its BLS projection released in 2007 as entirely due to the cyclical factors.
Overview of the BLS Projections
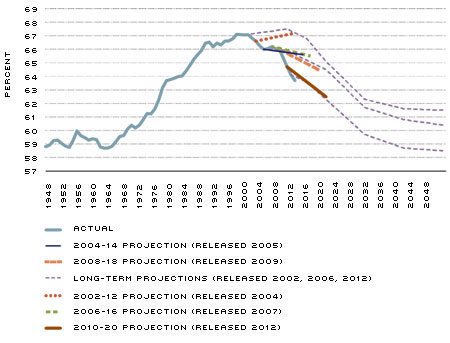
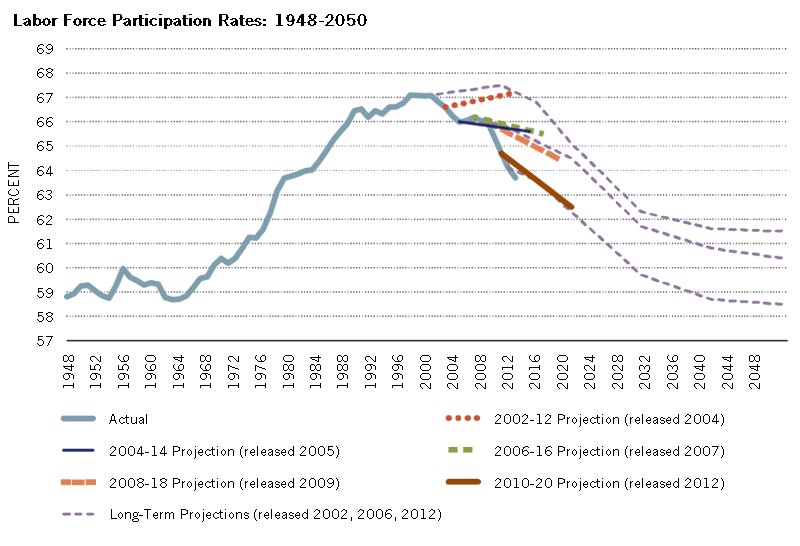
The BLS periodically releases long-term (50-year) projections of the labor force, while it releases medium-term (10-year) projections every two years. The projections include the demographic composition of the population and the LFP rates of different demographic groups, among other statistics. The figure shows the actual annual aggregate LFP rate from 1948 to 2012, and the medium- and long-term BLS projections after 2000.
Labor Force Participation Rates: 1948-2050
NOTE: The actual aggregate LFP rate is the annual LFP rate for the period 1948-2012.
SOURCES: Actual LFP rate data from the Bureau of Labor Statistics/Haver Analytics; BLS projections data are from Table 3 in Toossi, 2002; Toossi, 2004; Toossi, 2005; Toossi, 2006; Toossi, 2007; Toossi, 2009; Toossi, 2012a; and from Toossi, 2012b.
The long-term projections provide projections at 10-year intervals until 2050. As can be seen from the figure, all three long-term projections—those released in 2002, 2006 and 2012—show an eventual decline in the aggregate LFP rate. For 2030, all three projections show low aggregate LFP rates, at 62.3, 61.7 and 59.7 percent, respectively. The 2012 projection continues to decline and the LFP rate is projected to reach 58.5 percent in 2050, an LFP rate lower than what it was in the early 1960s, when the rate began its steady increase.
The BLS lists the following factors as primary drivers of the decline in the LFP rate since 2000: (1) the aging of the baby boomer cohort; (2) the decline in the participation rate of those 16-24 years old; (3) the declining LFP rate of women (since its peak in 1999), and (4) the continuous decline of the LFP rate of men (since the 1940s). The main factors that keep the aggregate LFP rate from falling further are the increase of the LFP rate of those 55 and older and the strong attachment to the labor force of Hispanic and Asian people, who constitute the main share of the immigrant population.
The most recent medium-term projections (brown line in figure) were released in January 2012 for 2010-2020.3 The BLS projected that the aggregate LFP rate would be 62.5 percent in 2020. This represents a 2.2-percentage-point decline from the LFP rate in 2010. The BLS projection of the 10-year change in the LFP rate between 2010 and 2020 is almost equal to the change during the previous decade, when the LFP rate declined by 2.4 percentage points (from 67.1 percent in 2000 to 64.7 percent in 2010).
The BLS-projected change in the aggregate LFP rate between 2010 and 2020 can be broken into two components: (1) the change in the age composition of the population, and (2) the change in the LFP rates of different age groups. We found that the change in the age composition of the population accounted for most (2.18 out of 2.20 percentage points) of the decline in the aggregate LFP rate over the period. Specifically, this 2.18-percentage-point contribution to the LFP rate decline was mostly driven by a 3-percentage-point decrease in the population share of those 45-54 years old. In contrast to the 2.18-percentage-point decline in the LFP rate that resulted from changes in the age composition of the population, the change in the aggregate LFP rate due to the changes in the LFP rates of different age groups is almost zero on net. It is important to note that this value is the result of dissimilar dynamics of individual groups rather than consistent behavior of the population. For example, the largest contributions to the increase in the aggregate LFP rate are posted by those 55-64 years old (0.63 percentage points) and 65-74 years old (0.65 percentage points). Yet the increases in the LFP rates of these older workers are almost completely nullified by the decreases in the LFP rates of those 16-19 years old (–0.55 percentage points) and 20-24 years old (–0.44 percentage points).
Differences between the 2008-2018 and 2010-2020 Medium-Term Projections
As can be seen in the figure, the medium-term projection released in 2012 for the 2010-2020 change in the aggregate LFP rate represents almost a downward shift of the earlier medium-term projection, released in 2009 for the 2008-2018 change. While the actual LFP rate declined by 1.3 percentage points between 2008 and 2010, the difference between the medium-term LFP rate projections for 2018 from the two forecasts is 1.56 percentage points.4 A closer examination of the differences between the two projections reveals that the 2010-2020 projection shows lower LFP rates for all age groups. The most significant difference between the two projections is recorded for young groups. In particular, the differences in the projected LFP rates for 2018 from the two projections for 16-19, 20-24 and 25-34-year-olds are –5.62, –4.3 and –1.48 percentage points, respectively.5 These groups also experienced the largest decline in their actual LFP rates between 2008 and 2010.
What factors caused the change in the BLS medium-term projections from 2008 to 2010? The BLS states, "The standard BLS labor force projection model is based on an extrapolation of past participation rates after a process of numerical smoothing and filtering. Such a model incorporates demographic factors, but does not directly take into account the behavioral aspects, economic factors, structural changes, and dynamic conditions of the labor market." 6 Thus, as the BLS model is an extrapolation-based model, it appears that the sharp decline in the actual LFP rate between 2008 and 2010 contributed to the downward shift of the BLS medium-term projections released after 2010.
One approach to determining the trend versus cyclical component in the current LFP rate is to treat the projections released prior to the Great Recession as a measure of the trend. (See, for example, Erceg and Levin.) It is inaccurate, however, to attribute the difference between the actual LFP rate and the projection as entirely due to the cyclical factors. Namely, the BLS' methodology may have resulted in the prerecession period's relatively high LFP rate influencing the 2007 projections to a substantial degree, while economic factors and dynamics of the labor market were not directly taken into account.
Conclusion
The BLS projections show the LFP rate continuing its decline, reaching 62.5 percent in 2020 (using the 2010-2020 medium-term projection). Since 2000, the BLS has projected the long-term decline in the LFP rate, indicating that the high LFP rate that we saw in 2000 might be a figure of the past. In particular, the decline in women's LFP since 1999 is not expected to reverse. The BLS does not expect the large decline in the LFP rates for the youngest group, 16-24-year-olds, to reverse either. To the extent that the decline for the youngest group is due to the time spent at school, it is possible that these workers will show a higher labor force attachment once they are out of school.
Endnotes
- The studies on this question include those by Hotchkiss and Rios-Avila; Bengali, Daly and Valletta; and Erceg and Levin, among others. [back to text]
- Every two years, the Bureau of Labor Statistics produces medium-term, or 10-year, labor force projections. Every several years, longer-term projections of the labor force are carried out to elicit possible future paths of labor force growth during the following 50 years. [back to text]
- See Toossi, 2012a. [back to text]
- We use a linear interpolation to obtain the projected LFP rate for 2018 from the 2010-2020 projections. [back to text]
- See also Daly, Elias, Hobijn and Jordà. [back to text]
- See Toossi, 2011, p. 27. [back to text]
References
Cochrane, John. "Job Market Doldrums." June 13, 2013. See http://johnhcochrane.blogspot.com/2013/06/job-market-doldrums.html#more.
Bengali, Leila; Daly, Mary; and Valletta, Rob. "Will Labor Force Participation Bounce Back?" Federal Reserve Bank of San Francisco Economic Letter, May 2013, No. 14. See www.frbsf.org/economic-research/publications/economic-letter/2013/may/will-labor-force-participation-bounce-back.
Daly, Mary; Elias, Early; Hobijn, Bart; and Jordà, Òscar. "Will the Jobless Rate Drop Take a Break?" Federal Reserve Bank of San Francisco Economic Letter, December 2012, No. 37. See www.frbsf.org/economic-research/publications/economic-letter/2012/december/jobless-rate-drop.
Erceg, Christopher J.; and Levin, Andrew T. "Labor Force Participation and Monetary Policy in the Wake of the Great Recession." Federal Reserve Board, April 2013. Unpublished manuscript. See www.bos.frb.org/employment2013/papers/Erceg_Levin_Session1.pdf.
Hotchkiss, Julie L.; and Rios-Avila, Fernando. "Identifying Factors behind the Decline in the Labor Force Participation Rate." Business and Economic Research, Macrothink Institute, 2013, Vol. 3, No. 1. See www.macrothink.org/journal/index.php/ber/article/download/3370/2921.
Toossi, Mitra. "A Century of Change: the U.S. Labor Force, 1950-2050." Monthly Labor Review, Bureau of Labor Statistics, May 2002, pp. 15-28.
Toossi, Mitra. "Labor Force Projections to 2012: the Graying of the U.S. Workforce." Monthly Labor Review, Bureau of Labor Statistics, February 2004, pp. 37-57.
Toossi, Mitra. "Labor Force Projections to 2014: Retiring Boomers." Monthly Labor Review, Bureau of Labor Statistics, November 2005, pp. 25-44.
Toossi, Mitra. "A New Look at Long-term Labor Force Projections to 2050." Monthly Labor Review, Bureau of Labor Statistics, November 2006, pp. 19-39.
Toossi, Mitra. "Labor Force Projections to 2016: More Workers in Their Golden Years." Monthly Labor Review, Bureau of Labor Statistics, November 2007, pp. 33-52.
Toossi, Mitra. "Labor Force Projections to 2018: Older Workers Staying More Active." Monthly Labor Review, Bureau of Labor Statistics, November 2009, pp. 30-51.
Toossi, Mitra. "A Behavioral Model for Projecting the Labor Force Participation Rate." Monthly Labor Review, Bureau of Labor Statistics, May 2011, pp. 25-42.
Toossi, Mitra. "Labor Force Projections to 2020: a More Slowly Growing Workforce." Monthly Labor Review, Bureau of Labor Statistics, January 2012a, pp. 43-64.
Toossi, Mitra. "Projections of the Labor Force to 2050: a Visual Essay." Monthly Labor Review, Bureau of Labor Statistics, October 2012b, pp. 3-16.
Views expressed in Regional Economist are not necessarily those of the St. Louis Fed or Federal Reserve System.
For the latest insights from our economists and other St. Louis Fed experts, visit On the Economy and subscribe.
Email Us