


State and Local Debt: Growing Liabilities Jeopardize Fiscal Health
Debt has been increasingly on our minds over the past few years—and not in a good way. The European debt crisis has roiled financial markets and exposed unsustainable fiscal policy on the part of international governments. Greece, the central player in the calamity, amassed debt valued at roughly 160 percent of GDP as of fiscal year (FY) 2011. In the United States, the federal debt dilemma continues to perplex lawmakers as they attempt to rein in a historic gross debt level of about 100 percent of GDP. Not only are nations (and individuals) wrestling with growing debt levels, but so are state and local governments, including those in the seven states that make up the Eighth Federal Reserve District.1
The financial obligations of states extend beyond the bonds issued by state governments; we prefer to combine state and local government debt with unfunded pension and retiree health-benefit obligations. Treating states' unfunded obligations to retirees as debt, and combining them with existing indebtedness, provides a more accurate comparison of fiscal health. We then measure these financial obligations as a percentage of gross state product (GSP); this percentage shows debt totals relative to the size of the state economy, leading to an understanding of how burdensome the debt is.
Among our findings is that the combined obligation for the Eighth District states averaged out to 28 percent of GSP in FY 2010, close to the average amount of non-mortgage debt that a household carries.2 We also found that the market for state government debt does not reflect the fiscal health of the District's states. Specifically, the best-performing state did not receive the most-favorable interest rate; similarly, the worst-performing state did not pay the highest interest rate on its debt.
State Government Debt
The federal government's budget contains large outlays for such things as defense and social welfare programs (Medicare, Social Security and the like). The budgets for state governments are characterized by spending for economic development projects, public universities, natural resource preservation, etc. To meet these spending goals, governments have the option to issue debt to investors in the form of government bonds. All government bonds are explicitly backed by taxes of some sort; revenue bonds are backed by a specific revenue source, while general obligation bonds can be fulfilled by any tax revenue raised by the issuing government.
Of the Eighth District states, Illinois had the largest state government debt in FY 2010 (the latest year for which data were available) at 9.5 percent of GSP. (See the first column of the table.) Kentucky, Indiana and Missouri were not far behind Illinois with 9.0, 8.8 and 8.4 percent, respectively. Given California's notoriety with regard to state fiscal conditions, it is also included in the table for comparison purposes. California's state debt rose considerably between FY 2008 and FY 2010, reaching 7.9 percent of GSP, still markedly lower than the poorest performing states in the District. Tennessee serves as a great example of frugality, as its state government debt stayed below 2 percent of GSP for most of the past decade. Since 2000, every District state—even the most prudent—has increased its state debt-to-GSP ratio.
Local Government Debt
In addition to the state government, local governments—those of towns, cities and counties, for example—are free to issue debt to finance their local operations. Local governments issue debt to fund emergency services, public schools, court systems, etc. In all of the District states, local governments have issued a greater amount of debt (combined) than state governments have. (See the second column of the table.) In some states, the difference is striking; for instance, total local government debt in Kentucky and Tennessee was close to two times and six times greater than state government debt, respectively.
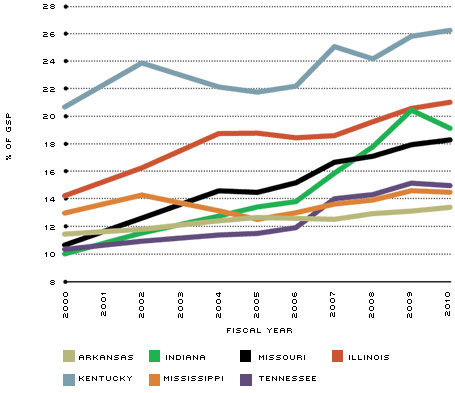
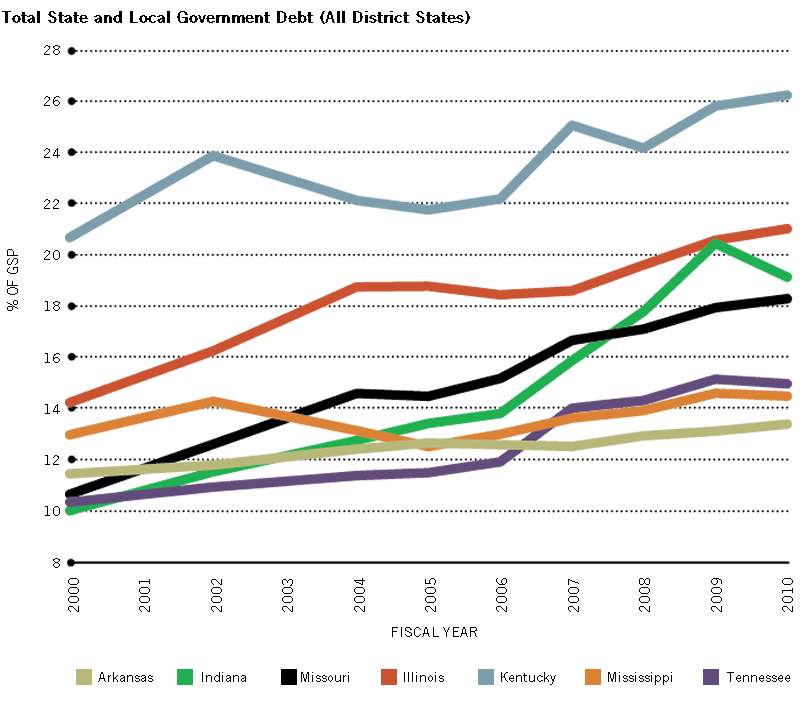
Figure 1 plots total (state and local) government debt as a percentage of GSP. After tacking on local government debt valued at 17.2 percent of GSP, Kentucky's total debt is far above that of the rest of the Eighth District states. The total debt of Illinois and California was roughly the same by the end of FY 2010. It is clear that local government debt comprises a huge collective liability. However, that liability is spread across numerous municipalities, making the actual burden of debt (and risk of default) less transparent.
Figure 1A
Total State and Local Government Debt (All District States)
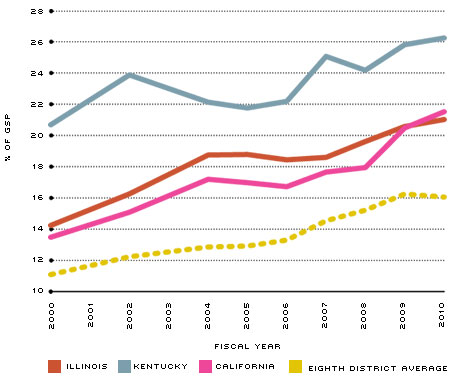
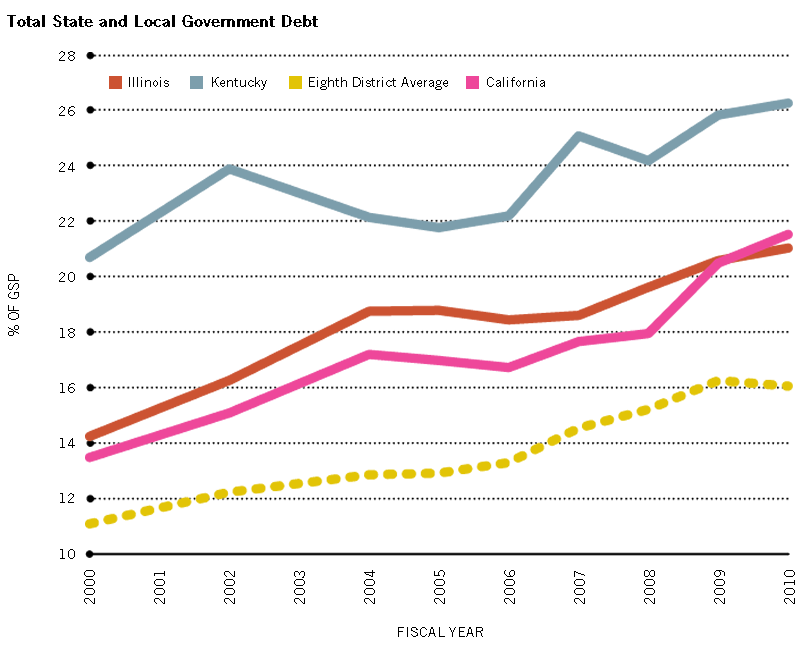
Figure 1B
Total State and Local Government Debt
NOTE: The Eighth District average excludes Illinois and Kentucky.
Municipal debt is often considered a relatively low-risk investment compared with other bonds because of the former's traditionally low default rates. However, a recent essay from the Federal Reserve Bank of New York found that the widely cited default rates as reported by the ratings agencies (Moody's and Standard & Poor's) contain a selection bias.3 Specifically, issuers are less likely to seek a rating from those agencies if they do not expect to receive an investment grade rating.4 Thus, the sample of bonds rated and monitored by the agencies will contain fewer poor performing bonds, and default rates could be understated.
Recent defaults discount the safety of municipal bonds, as several cities have made headlines with their fiscal woes. The city of Stockton, Calif., filed for Chapter 9 bankruptcy in late June, becoming the largest city to ever do so in terms of both population (about 300,000) and unmet financial liability ($700 million).5 Stockton was driven to bankruptcy primarily by large government projects and public employee pension programs. San Bernardino, Calif., faced similar difficulties on its road to bankruptcy as its employee retirement costs today are approximately double the 2006-2007 values.6
Public Pensions
State public sector pension systems have drawn a lot of attention recently as fiscal developments have undermined their long-term solvency. Lackluster investment returns and the consistent failure of state governments in making required contributions have led to growing unfunded liabilities.7 These unfunded liabilities now command a significant share of GSP. For example, as seen in the third column of the table, unfunded pension liabilities exceed 10 percent of GSP in Mississippi, Kentucky and Illinois. These liabilities continued to grow in most District states, as only Arkansas, Mississippi and Tennessee paid their actuarially required contribution in FY 2010 to get funding levels back on track. Kentucky, in particular, paid only 58 percent of what was necessary in FY 2010. Failing to meet the annual contributions is nothing new in some of the District states: Illinois, Missouri and Kentucky contributed less than what was required for the majority of the past 14 years, according to available data.
Making matters worse, the weak funding situation of pension systems was exacerbated by the market collapse following the 2008 financial crisis. Median investment returns across public pension systems amounted to –19.1 percent in FY 2009.8 The Illinois State Employees' Retirement System (SERS) achieved only a 3.1 percent return over the five-year period ending in FY 2011. For the same period, it had assumed a rate of return of 7.75 percent.9 The Illinois SERS assumption is not unusual as most public pension systems use an 8 percent assumed rate of return on investments. While most pension systems have achieved or exceeded their assumed rate of return over time, the recent investment landscape has been characterized by exceptionally low yields. Lowering return assumptions will increase estimates of unfunded liabilities considerably as about 80 percent of aggregate FY 2011 public pension revenue came from investment returns.10
Retiree Health-Care Benefits
The final component of our debt calculation is the unfunded liability from state retiree health-benefit programs. The fourth column of the table shows these totals as a share of GSP, and once again Kentucky and Illinois have the largest unfunded liabilities. The vast majority of state retiree health-benefit systems across the country are heavily underfunded with an average funding rate of only 8 percent.11 To make matters worse, the average contribution across the U.S. states was about 43 percent of what was required in FY 2010. These liabilities are particularly concerning given soaring health-care costs, which could quickly ratchet up obligations in the future beyond what is projected. However, unlike pensions, these retiree health benefits have less legal protection, and states could cut back on their obligations.
The Combined Debt Burden
The fifth column of the table combines state government debt, local government debt, the unfunded public pension liability and the unfunded retiree health-care liability. Taken together, these components offer a comprehensive look at the debt burden confronting these states. If you take the state debt burdens as we have measured them and add the additional burden coming from the U.S. federal debt, then several of the states in the District have total debt-to-GDP ratios that are close to Greece's.
Illinois and California have captured the lion's share of media attention and have been characterized as having the worst fiscal health in the country. The table shows that this notoriety is backed up by the data, as Illinois and California have a combined obligation of 39.6 percent and 31.7 percent of GSP, respectively. Kentucky surpasses the troubled states with a combined obligation worth 41.6 percent of GSP. Local debt is where Kentucky surpasses both Illinois and California by a wide margin, but that should not distract from the fact that Kentucky also surpasses California in each of the other three components. Despite having a worse standing, Kentucky has largely gone unnoticed and has received less scrutiny in financial markets than its lackluster counterparts.
Market Reaction
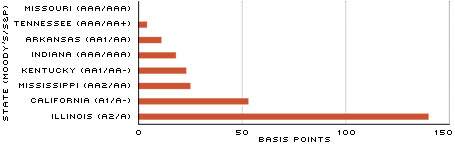
Figure 2 shows the spread between yield rates of state government bonds maturing in 10 years and a benchmark yield rate derived from AAA-rated bonds of the same maturity. A yield spread greater than zero means that a state must pay a higher interest rate on its debt than is expected of a typical AAA-rated state that issues bonds.
Figure 2
Yield Spread Between State 10-Year Bonds and 10-Year AAA Benchmark Rate
SOURCE: Thomson Reuters Municipal Market Data.
NOTE: Yields measured for general obligation, tax-exempt bonds. Data as of Sept. 14, 2012.
The fiscal health of the District states as shown in the table is not reflected in the corresponding yields that investors are requiring from states. In the District, only two states (Missouri and Indiana) received a AAA rating on their debt by both of the rating agencies. Surprisingly, these two states share a similar debt burden that is greater than that of both Arkansas and Tennessee. Furthermore, Tennessee, while holding a dramatically lower combined obligation than all of the other District states, still misses out on the highest rating from Standard & Poor's.
While concurrently sporting the worst rating among the District states, Illinois pays the most on its debt among the states—a yield spread of 140 basis points. While an extra 1.4 percent on its debt does not seem terrible, it can quickly add up to a significant loss. For example, an issuance of $1.8 billion in 10-year bonds would cost Illinois close to an extra $252 million over the lifetime of the bonds. Given the size of Illinois' economy, this added borrowing cost wouldn't bankrupt the state but it would continue to further impair the state's fiscal health.
All the while, Kentucky enjoys quite reasonable borrowing rates despite harboring a mountain of debt. Investor sentiment can be difficult to rationalize at times, and the confidence that the market has in Kentucky's ability to reconcile its collective debt should raise eyebrows. Government officials would be wise to bring their fiscal house in order rather than rely on the kindness of investors, a beguiling comfort that has proved fickle in the past.
Debt: Enjoy in Moderation
Given historically high levels, government debt has been sometimes cast as an evil that must be rooted out of government balance sheets. It is important to remember that government borrowing is not inherently a bad decision. Many of the projects financed through state and local government debt greatly benefit society and would not occur in a timely fashion without the ability to issue debt. It is also somewhat unfair to harangue governments about rising debt levels in the years following the recession. Economists Carmen Reinhart and Kenneth Rogoff found that falling tax revenue and countercyclical fiscal policies were the main cause of ballooning government debt levels following financial crises.
In contrast, the growing unfunded liabilities of the pension and health-benefit systems deserve less forgiveness. Governments have repeatedly made promises to future retirees that they cannot honor, given the current state of their finances. Consequently, difficult reforms lie ahead for retirement systems at both the state and local levels. Government leadership must rise to the challenge and rein in rising debt obligations, lest a domestic debt crisis become more than just a figment of nightmares.
Endnotes
- The Eighth Federal Reserve District contains all of Arkansas and portions of Illinois, Indiana, Kentucky, Missouri, Mississippi and Tennessee. The data cited in this article for each of these states are for the entire state, not just the portion within the District. [back to text]
- In the second quarter of 2012, the average household in the United States held non-mortgage debt valued at 25 percent of personal income. This figure is based on calculations using data from the Federal Reserve Board and the Bureau of Economic Analysis. [back to text]
- See Appleson, Parsons and Haughwout. [back to text]
- Investment grade is defined as having a low probability of default. For example, according to Moody's ratings system, any bond rated above Baa is considered to have low credit risk. In contrast, any bond rated below Baa is considered speculative and subject to substantial risk. Such low-rated bonds are popularly termed "junk" bonds. [back to text]
- See White. [back to text]
- See Phillips. [back to text]
- An unfunded liability is a portion of an outstanding liability that is not covered by an asset of greater or equal value. [back to text]
- See Brainard. [back to text]
- See State Employees' Retirement System of Illinois. [back to text]
- See Becker-Medina. [back to text]
- See Pew Center on the States. Also, the funding rate refers to the share of total liabilities that are covered by assets—in other words, the share of the bill that can be paid as of right now. The actuarially required contribution is the amount of assets that need to be set aside that year in order to both stay solvent and eventually reach full funding levels. [back to text]
- See Reinhart and Rogoff.
References
Appleson, Jason; Parsons, Eric; Haughwout, Andrew. "The Untold Story of Municipal Bond Defaults." Liberty Street Economics, Aug. 15, 2012. See http://libertystreeteconomics.newyorkfed.org/2012/08/the-untold-story-of-municipal-bond-defaults.html
Becker-Medina, Erika. "Annual Survey of Public Pensions: State-Administered Defined Benefit Data Summary Report: 2011." U.S. Census Bureau, August 2012. See http://www2.census.gov/govs/retire/2011_summary_report.pdf
Brainard, Keith. "Public Fund Survey Summary of Findings for FY 2009." National Association of State Retirement Administrators, November 2010. See www.publicfundsurvey.org/publicfundsurvey/pdfs/Summary%20of%20Findings%20FY09.pdf
Pew Center on the States. "The Widening Gap Update." June 2012. See www.pewstates.org/uploadedFiles/PCS_Assets/2012/Pew_Pensions_Update.pdf
Phillips, Erica E. "San Bernardino Files for Bankruptcy." The Wall Street Journal, Aug. 2, 2012. See http://online.wsj.com/article/SB10000872396390443866404577564922008926122.html
Reinhart, Carmen M.; and Rogoff, Kenneth S. "The Aftermath of Financial Crises." American Economic Review: Papers & Proceedings, 2009, Vol. 99, No. 2, pp. 466-72.
State Employees' Retirement System of Illinois. "Comprehensive Annual Financial Report for the Fiscal Year Ended June 30, 2011." February 2011. See www.state.il.us/srs/PDFILES/oldAnnuals/SERS11.pdf
White, Bobby. "Stockton Files for Bankruptcy Protection." The Wall Street Journal, June 29, 2012. See http://online.wsj.com/article/SB10001424052702304058404577495412282335228.html


Views expressed in Regional Economist are not necessarily those of the St. Louis Fed or Federal Reserve System.
For the latest insights from our economists and other St. Louis Fed experts, visit On the Economy and subscribe.
Email Us