


Accounting for U.S. Growth: Is There a New Normal?
The U.S. economy's pace of growth during this business expansion has been unusually tepid. Since the second quarter of 2009, real GDP growth has exceeded 4 percent in only one quarter. Moreover, the unemployment rate remains stubbornly high, well above what most forecasters consider its natural rate. This development has caused some economists to wonder if the latest recession and financial crisis have raised the economy's natural rate of unemployment.
Two other labor market developments stand out. First, labor productivity growth (output per hour) accelerated sharply late in the recession and early in the recovery, as firms cut labor input dramatically in response to weak demand for their goods and services. From the first quarter of 2009 through the first quarter of 2010, productivity growth averaged 5 percent. But since the second quarter of 2010, labor productivity growth has slowed to about 1 percent per quarter on average.
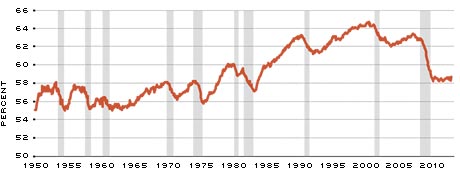
A second key development has been the steep decline in the percentage of the population that is employed over the past two business expansions. Since late 2009, the percentage of the working age civilian population (age 16 and over) that is employed appears to have stabilized at about 58.5 percent. This is the smallest percentage in about 30 years. The purpose of this article is to show how these two key series—labor productivity and the percentage of the population that is employed—can be used to assess the economy's underlying performance from a longer-term perspective.
A Framework for Analyzing Long-Run Economic Performance
Many aspects of our future society depend on how high the sustainable growth rate of real (inflation-adjusted) GDP turns out to be. For example, the profitability of firms and, therefore, trends in stock prices will depend in good part on the U.S. growth rate, as will the average tax rate we pay. Given that some government outlays are growing in real terms, especially expenditures for Social Security and Medicare, the higher the growth rate of real GDP, the lower will be the average tax rate on labor and capital that yields the revenue required to service these commitments. Lower tax rates also create more incentives for work and investment, both of which promote higher economic growth. Economic growth itself generates growth in government revenue, which can yield budget surpluses, which raise national saving and, therefore, national investment in productivity-enhancing capital. From a longer-run perspective, then, policies that boost saving and investment in physical capital will, all else equal, raise productivity and living standards.
Discussions of productivity and economic growth most often concentrate on invention and innovation. However, the functioning of the labor market is also extremely important to economic growth. For one thing, a labor market that fails to place the right workers in the right jobs will fail to obtain the full benefits of workers' skills and aptitudes that help to create high productivity growth.
Economists use the growth accounting framework to analyze long-run economic growth since the framework embodies these principles. This framework is straightforward: GDP growth depends on the growth of hours worked (labor input) and the growth of labor productivity (output per hour). Over the long run, labor input is determined primarily by the growth of the total population and, as we'll see, the percentage of the population that is employed. But since population growth tends to be relatively constant, or changes slowly, productivity growth is, thus, the key source of increases in living standards.
Other factors can generate increases or decreases in the growth rate of our standard of living for a period of some years. One such factor is the fraction of the output (income) of our economy that we choose to consume (or, equivalently, the fraction of the output that we choose to save). Saving is the raw material for investment in capital goods, and higher investment rates are good for long-run growth.1 A higher saving rate is, thus, crucial for boosting the economy's long-term growth prospects.
A second factor that can drive growth is the average number of hours each employed person in the economy works per year. All else equal, an increase in hours worked generates increases in output. The average number of hours that employees work per year is a choice variable for society.
A third factor is the employment-to-population (E/P) ratio. From the perspective of long-run trends in labor utilization, this ratio is one of the most important labor statistics. This analysis will focus on this third factor since it has important implications for the growth potential of our economy.
Civilian Employment as a Percent of the U.S. Population
SOURCE: Bureau of Labor Statistics
Data through September 2012.
A Growth Accounting Framework
The growth accounting framework is a useful metric for assessing the economy's potential long-run economic performance because it decomposes the growth of real GDP into its two primary contributions: labor inputs and labor productivity.2 The importance of labor input follows a standard economic formulation of the production process that transforms inputs (including technology) into outputs. In this formulation, output (real GDP) is a function of labor, capital and productivity.3 To make clear an obvious point, if over time people work fewer hours per week and retire at increasingly younger ages, labor input to the economy will grow more slowly or even shrink.
Declining labor input can easily cancel out improvements in productivity growth, leaving real GDP growth unchanged or even lower than before.
A modified version of this framework builds upon the following identity that links labor inputs with productivity to produce real GDP:
GDP = (GDP/Hours Worked) * (Hours Worked/Workers) * (1)
(Workers/Population) * Population
or, combining terms gives,
GDP = (GDP/Workers) * (Workers/Population) * Population, (2)
where GDP/Workers is average labor productivity, and the remaining terms simply condense to the civilian E/P ratio times the working age population (16 and older).4
The growth accounting framework described above is depicted in the table accompanying this article. In this representation, the contributions to real GDP growth are shown for the current and previous three business expansions. Since most recessions are caused by disturbances (shocks) that have temporary effects, the analysis excludes recession periods. In the table, the projections are expressed as compound annual rates of change for the periods indicated.
There are several important points to take away from the table. First, as line 1 indicates, population growth has been fairly steady over this period, averaging about 1.2 percent per year. Second, as indicated in line 5, real GDP growth has steadily slowed since the 1982-1990 business expansion, when growth averaged 4.3 percent per year. Real GDP growth remained robust during the 1991-2001 expansion, averaging about 3.6 percent per year. However, growth has been remarkably staid in the current and previous (2001-2007) expansions, averaging about 2.2 percent and 2.7 percent, respectively.
What accounts for the marked downshift in real GDP growth in this expansion compared with the previous three expansions?
The rate of labor productivity growth is the first place where economists typically look to find evidence of stronger or weaker economic growth. However, the table indicates that productivity growth has been relatively stable since the early 1980s, averaging a little less than 2 percent. The one exception was the 2001-2007 expansion, when average productivity growth slipped to 1.5 percent. As noted above, labor productivity growth since the middle of 2010 has slowed to an average of about 1 percent per quarter. But it is difficult to determine at this point whether the productivity downshift over the past two years is permanent or temporary. Most professional forecasters continue to project that productivity growth over the long run will average about 2 percent.5
Thus, rather than a slowdown in labor productivity growth, a sharp decline in the E/P ratio instead appears to be the smoking gun behind the apparent slowdown in real GDP growth over the past 20 years or so. This slowdown can be seen more clearly in the figure, which plots the E/P ratio since 1950. From 1950 to 1982, the E/P ratio fluctuated between 55 and 60 percent. After 1982, though, an increasingly larger percentage of the population entered the work force. By 2000, the E/P ratio had risen to an all-time high of a little less than 65 percent. This turned out to be its peak. After the 2001 recession, the E/P ratio declined to 62 percent, but then rose modestly during the 2001-2007 expansion. On net, though, the ratio fell slightly, as seen by its negative contribution in the table. Overall, the slowing in real GDP growth from 3.6 percent in the 1991-2001 expansion to 2.7 percent during the 2001-2007 expansion was attributable to a roughly equal split between slower productivity growth and a smaller share of the population working.6 That is, the change in productivity growth was –0.51 percent and the change in the E/P was –0.45 percent.
The figure shows that the E/P ratio fell sharply further during the 2007-2009 recession. In fact, since January 2010, it has averaged 58.5 percent, well below the 62.7 percent average for the 2001-2007 expansion. Although average labor productivity growth in the current expansion is modestly larger than in the previous expansion—despite the extremely weak growth since the second quarter of 2010—it cannot compensate for the significant decline in the contribution of the percentage of the population that is employed. Importantly, the table shows that if the decline in the E/P ratio is permanent—that is, it stabilizes at its current level so that its growth rate becomes zero—and labor productivity growth remains about 1.75 percent, then the U.S. economy will grow at about 2.75 percent (assuming 1 percent population growth). This estimate is pretty close to the 2.6 percent projection that the Survey of Professional Forecasters expects for real GDP growth over the next 10 years.
How To Boost Growth
As the earlier discussion indicated, the growth accounting framework shows that there are three ways for the economy to grow faster: stronger growth of labor productivity, faster population growth or a larger share of the population working.
Given that population growth changes slowly and has been relatively constant over the past several decades, the focus turns to the other two factors. Thus, one way for the economy to grow faster is if the E/P ratio begins to increase and returns to its levels seen in the previous two expansions. But if the higher E/P ratios during these expansions were a temporary departure from the long-term norm—perhaps because of the housing and technology booms of the 1990s and 2000s—then the economy's growth will have to depend crucially on labor productivity growth (assuming a constant rate of growth in the population). However, if the sharp deceleration in labor productivity growth seen over the past two years persists, and the E/P ratio stabilizes around its current level, then the economy's new normal might be something closer to 2 percent rather than 3 percent growth in real GDP.
Endnotes
- There is some point where higher investment rates yield proportionately smaller returns for the economy. This is known as the law of diminishing marginal returns. [back to text]
- This analysis ignores the distinction between output and employment of the farm and nonfarm sectors. Moreover, in this analysis, labor productivity is measured for the private, nonfarm sector. [back to text]
- In technical terms, this is known as a Cobb-Douglas production function. For more information on this, see www.dictionaryofeconomics.com/article?id=pde2008_C000183 [back to text]
- A more elaborate version of the growth accounting table is published each year in the Economic Report to the President. For the 2012 report, see www.gpo.gov/fdsys/pkg/ERP-2012/content-detail.html [back to text]
- Each year, the Federal Reserve Bank of Philadelphia publishes the results of a survey of professional forecasters that asks them to provide their estimate of productivity growth over the next 10 years. In the February 2012 survey, their estimate was 1.9 percent, which is roughly the average estimate seen over the previous five surveys. This survey can be found at www.phil.frb.org/research-and-data/real-time-center/survey-of-professional-forecasters/2012/spfq112.pdf [back to text]
- The 2001 recession began in March 2001 and ended in November 2001. [back to text]

Views expressed in Regional Economist are not necessarily those of the St. Louis Fed or Federal Reserve System.
For the latest insights from our economists and other St. Louis Fed experts, visit On the Economy and subscribe.
Email Us