


Housing's Great Fall: Putting Household Balance Sheets Together Again
Declining U.S. house prices have contributed significantly to the deepest global recession and the most severe financial crisis in many decades.1 At the level of individual U.S. households, falling house prices appear to be a significant cause of mortgage defaults.2 At least 7 million mortgage foreclosures were initiated during 2007 and 2008 combined, and all indications are that the rate of foreclosures will remain high for some time.3
Falling house prices have inflicted severe damage on many banks and other financial institutions, such as Fannie Mae and Freddie Mac, the government-sponsored mortgage lenders, because many repossessed houses now are worth less than the mortgage debt they secure. Likewise, the market values of securitized residential mortgages have fallen, imposing losses on investors around the world.4 Continuing distress among millions of homeowners, together with many weakened financial institutions, may delay the economic recovery.
Why are house-price declines so dangerous and disruptive? Can we prevent this from happening again?
More Damaging Than Stock Declines
Perhaps surprisingly, U.S. households' $4 trillion loss of value since the end of 2006 on the houses they own is far less than the decline in households' stock-market wealth of $10 trillion that occurred after mid-2007 or the $8 trillion loss of stock-market wealth that occurred during 2000-02. Yet, many economists believe declining house prices have been more damaging than either of the two recent large stock-market declines.
Three features of homeownership in the U.S. help explain the severe fallout from declining house prices. First, unlike stock ownership, homeownership is widespread among households at most income levels. (See Table 1.) About two-thirds of families are homeowners, while only about half owned stock directly or indirectly in 2007, with most stock-market exposure concentrated at upper income levels.5
Second, for the vast majority of households, the value of their house (if they own one) is much larger than their stock portfolio (if they have one) or any other investment. The median value of a house was about $191,000, while the median stock holdings among households with a portfolio were $35,000, both measured before the recent declines.
Third, houses usually are financed, in part, with mortgage debt. (See Table 1.) For all but the lowest quarter of family incomes, a majority of homeowners have mortgage debt. Leverage, or borrowing to finance an asset purchase, causes the owner's gains and losses on the asset to be magnified.6 Thus, families are more likely to own houses than stocks; for most home-owning families, the value of their house far exceeds their stock portfolio; and housing often is a leveraged investment. Declining house prices, therefore, directly affect more families—and more significantly—than does a falling stock market.
Why This Time Is Different
High rates of homeownership and mortgage borrowing are not new developments in the U.S. What seems to have made this house-price decline so severe is, first, that house prices rose so far, so fast—especially in some areas, such as California, Nevada, Arizona and Florida—and then fell hard and fast. Second, the amount of mortgage debt taken on by millions of households appears, in retrospect, to have been excessive. House prices, therefore, have declined more than at any time since the 1930s precisely when many more households were vulnerable to the magnified effects of high leverage than ever before.
Chart 1 shows the ratios of house prices to per-capita personal incomes in Florida and Missouri, examples of "boom" and "quiet" markets, respectively. Average house prices in Florida rose much faster after 2000 than incomes, and those prices have fallen sharply since 2006. Not surprisingly, foreclosure rates in Florida have skyrocketed, as shown in Chart 2. House-price-to-income ratios and foreclosure rates also increased and then decreased in Missouri, but by much less.
Meanwhile, the burden of servicing all types of debt averaged across all families rose from 10 percent of family income in 1989 to about 12.5 percent in 2000 to almost 15 percent in 2007.7 These three years correspond to the respective peaks of the past three economic expansions, just before recessions began and house-price growth slowed. It's clear that a long-term trend toward larger debt burdens occurred across the U.S., making many households more vulnerable to economic and financial shocks.
As most house prices fell after 2006, mortgaged homeowners' equity fell even faster. Homeowners overall have lost almost $5 trillion of homeowners' equity through the first quarter of 2009, even though house values fell only about $4 trillion. The greater decline in homeowners' equity reflects the fact that, as house prices fell after 2006, mortgage debt continued to rise until recently.8 Considering only homeowners with mortgage debt (about two-thirds of all homeowners), the average loss of homeowners' equity is in the neighborhood of 70 percent, due to the magnifying effects of leverage. Of course, many home-owners have defaulted on their mortgages already and, unfortunately, many more are likely to do so—particularly if house prices continue to fall and the unemployment rate rises further.
Lessons Learned
One clear lesson from the housing crash and foreclosure crisis is that house prices can fall sharply, even on a nationwide basis. Remarkably, it had become almost an article of faith earlier in this decade among many mortgage lenders and borrowers that house prices would not fall significantly, even in overheated markets. It was assumed that most homeowners simply would wait to sell their houses until demand recovered, rather than dumping their properties into a falling market. As it turned out, defaults increased sharply in 2006 and 2007. Banks and other owners of foreclosed properties did sell a large number of houses, even in falling markets. This unleashed a downward spiral of house prices which, in turn, contributed to more defaults.
Another key lesson is that mortgage borrowing can be excessive. Rather than focusing merely on the affordability of the initial monthly payments a household must make, it clearly is necessary to plan for any increases that could occur and to build in a margin of safety for unexpected financial stresses, such as unemployment or unexpected medical or other expenses.
The simplest way to avoid another devastating housing crash and foreclosure crisis probably is to reduce and maintain much lower levels of household leverage. Not only might less mortgage borrowing make households better able to withstand any future house-price declines or any other financial shocks that might occur, but it also might reduce the chance of house prices again rising to unsustainable levels.
Homeownership and Mortgage Borrowing By Family Income Category
| Family or individual income category in 2007 | Number of families in this category (millions) | Of which, number of families that are homeowners (millions) | Of which, number of families that have mortgage debt (millions) | Percent of families in this income category that are homeowners (%) | Percent of home-owning families in this income category with mortgage debt (%) |
|---|---|---|---|---|---|
| Less than $20,000 | 23.2 | 10.1 | 3.4 | 43.7 | 33.9 |
| $20,000 to $39,999 | 27.6 | 16.1 | 8.1 | 58.5 | 50.4 |
| $40,000 to $79,999 | 31.3 | 23.6 | 16.7 | 75.3 | 70.9 |
| $80,000 or more | 28.2 | 25.8 | 20.6 | 91.3 | 79.9 |
| Total population of families |
110.4 | 75.6 | 48.9 | 68.5 | 64.6 |
SOURCE: 2007 American Housing Survey, Bureau of the Census.
Ratio of House Prices to Per-Capita Personal Income
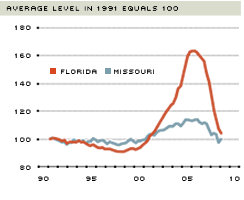
SOURCES: Federal Housing Finance Agency and Bureau of Economic Analysis. Quarterly data through Q1 2009.
Mortgage Foreclosure Rate
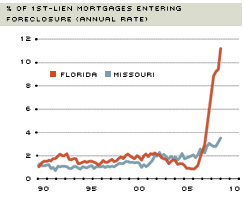
SOURCES: Mortgage Bankers Association. Quarterly data through Q1 2009.
Endnotes
- For a discussion of the role of falling house prices in the economic downturn and financial crisis, see Bernanke. [back to text]
- See Hatzius. [back to text]
- See Mortgage Bankers Association. [back to text]
- See Kohn. [back to text]
- See Bucks et al. and Census Bureau. [back to text]
- During the early part of this decade, when house prices generally were rising, the homeowners' equity of any household with mortgage debt increased faster, on a percentage basis, than the value of the house itself. For example, a doubling of the value of a $100,000 house on which there is a $50,000 mortgage results in a tripling of homeowners' equity (from $50,000 to $150,000). After house prices began to decline in about 2006, the same magnification effect has been working in reverse. [back to text]
- See Bucks et al. [back to text]
- See Federal Reserve Board. [back to text]
References
Bernanke, Ben S. "Four Questions about the Financial Crisis." Speech presented at Morehouse College, Atlanta, Ga., April 14, 2009. See www.federalreserve.gov/newsevents/speech/bernanke20090414a.htm.
Bucks, Brian K.; Kennickell, Arthur B.; Mach, Tracy L.; and Moore, Kevin B. "Changes in U.S. Family Finances from 2004 to 2007: Evidence from the Survey of Consumer Finances," Federal Reserve Bulletin, February 2009. See www.federalreserve.gov/pubs/bulletin/2009/pdf/scf09.pdf.
Census Bureau. "2007 American Housing Survey." See www.census.gov/hhes/www/housing/ahs/ahs.html.
Federal Reserve Board. Flow of Funds Accounts. See www.federalreserve.gov/releases/z1/default.htm.
Hatzius, Jan. "Beyond Leveraged Losses: The Balance-Sheet Effects of the Home-Price Downturn," Brookings Papers on Economic Activity, Fall 2008, pp. 195-227. See www.brookings.edu/press/Journals/2009/brookingspapersoneconomicactivityfall2008.aspx.
Kliesen, Kevin. "Survey Says Families Are Digging Deeper into Debt." Federal Reserve Bank of St. Louis The Regional Economist. Vol. 14, No. 3, July 2006, pp. 12-13. See www.stlouisfed.org/publications/re/2006/c/pages/debt.cfm.
Kohn, Donald L. Comments on "Financial Intermediation and the Post-Crisis Financial System" by Hyun S. Shin et al., at the Eighth Annual Bank for International Settlements Conference, "Financial System and Macroeconomic Resilience: Revisited," in Basel, Switzerland, June 25, 2009. See www.federalreserve.gov/newsevents/speech/kohn20090710a.htm.
Mortgage Bankers Association. National Delinquency Survey of May 28, 2009. See www.mortgagebankers.org/ResearchandForecasts/ProductsandSurveys/.

Views expressed in Regional Economist are not necessarily those of the St. Louis Fed or Federal Reserve System.
For the latest insights from our economists and other St. Louis Fed experts, visit On the Economy and subscribe.
Email Us