District Overview: Uneven Employment Growth Reflects Differing Mixes of Jobs
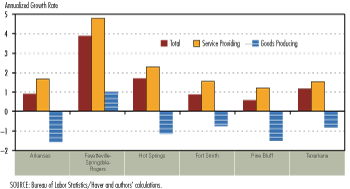
From the beginning of the current expansion in November 2001 through July 2006, nonfarm payroll employment in Arkansas grew by 0.91 percent annually, slightly higher than the national average of 0.73 percent. Among five metropolitan statistical areas (MSAs) outside of Little Rock-North Little Rock, employment growth was mixed. Fayetteville-Springdale-Rogers and Hot Springs led the pack with annual growth rates of 3.89 percent and 1.71 percent, respectively. The Texarkana MSA experienced above-average growth of 1.17 percent. However, Texarkana’s growth was largely bolstered by the public sector; private sector employment grew at an annual rate of only 0.61 percent. Of the MSAs that underperformed—Fort Smith (0.87 percent) and Pine Bluff (0.57 percent)—neither kept pace with the statewide transition from goods-producing to service-providing employment.
Over the course of the 1990s, U.S. employment followed a trend of reallocating from goods-producing sectors toward those offering services. Arkansas employment reflected this trend but retained its traditionally high concentration in goods-producing industries. In the early part of this decade, however, the shift in Arkansas employment accelerated, with the mix of jobs converging toward the national average. From 2000 through 2005, the share of employment in goods-producing industries in Arkansas fell from seven percentage points above the national average to 5.3 percentage points higher.
Those MSAs that exceeded Arkansas’ employment growth between November 2001 and July 2006 were also those that followed the statewide trend toward service-sector employment. The Fayetteville area ended the period with virtually the same concentration of employment in both the goods-producing and the service-providing sectors as Arkansas overall. The Fayetteville MSA continued to benefit from the rapid growth of big-name companies in the area, including Tyson Foods and Wal-Mart. Indeed, the Fayetteville-Springdale-Rogers MSA was the only one in the state to display positive employment growth in the goods-producing sector.
In Hot Springs, the share of service-providing employment remained well above the Arkansas average. Furthermore, service-sector employment growth in Hot Springs (2.3 percent annually) outpaced the state’s (1.67 percent).
Conversely, the MSAs with weak employment growth relative to the state’s were those that deviated from the trend toward the service sector. Pine Bluff, for instance, moved in the opposite direction; while the share of goods-producing employment in Pine Bluff was nearly 20 percent less than the state’s in 1990, these shares were roughly equal by July 2006. Perhaps more significant was the trend in Fort Smith, which employs roughly 10 percent of the total Arkansas labor force. Fort Smith remained relatively specialized in the goods-producing sector with over 30 percent more of its employees producing goods than the statewide average in July. Compared with the state’s, the concentration of goods-producing employment in Fort Smith has increased since 1990—a trend that began to accelerate at the beginning of the current expansion.
Certainly, there is nothing inherently bad about specialization in goods production. From November 2001 through July 2006, both Fort Smith and Pine Bluff performed relatively well in goods-producing employment compared with the rest of the state. With annual employment declines of 0.74 percent and 1.52 percent, respectively, these two MSAs fared better than the average 1.57 percent decline in goods-producing employment statewide. Yet, if Fort Smith had begun this expansion with the same concentration of employment in both the goods-producing and service-providing sectors as was observed statewide, its total employment growth through July would have outpaced the state’s. It is also important to note that goods-producing industries—particularly manufacturing—have generally experienced dramatic growth in labor productivity; thus, slow employment can be associated with rapid growth in output, sales and profits in these sectors.
Nonfarm Employment Growth by Sector
Seasonally Adjusted Monthly Data, November 2001 through July 2006

SOURCE: Bureau of Labor Stastics/Haver and authors' calculations.
Views expressed in Regional Economist are not necessarily those of the St. Louis Fed or Federal Reserve System.
For the latest insights from our economists and other St. Louis Fed experts, visit On the Economy and subscribe.
Email Us

