


National and District Overview: Patterns in the District Labor Market
Recent reports have revealed a national economy weaker than what most analysts had predicted. For example, the advance estimate of second-quarter gross domestic product (GDP) growth was 1.1 percent. More than 2 percent was expected. This relatively weak growth, in conjunction with other data, has led forecasters to lower their estimates of growth for the second half of this year. Some analysts have even suggested that the U.S. economy is poised to return to recession. Relative to the anemic pace of the second quarter, however, the majority of forecasters continue to predict faster growth in the national economy—approximately 2.5 percent—during the second half of this year. Growth during the first half of 2003 is expected to approach 3.5 percent. What are the implications of faster national growth for the Eighth District?
To answer this, I compare employment growth and unemployment rates in the District with those of the entire country. Generally, the District has behaved similarly to the national economy. But a closer look at individual counties within the District reveals much variation.
District vs. U.S.
Since 1981, employment in the District has grown at a rate slightly below the national rate. Generally, employment growth in the District has tended to move similarly to national employment growth. The simple correlation, which is a measure of the association between these two series, is 0.70. This measure suggests that increases (decreases) in employment growth in the District occur at the same time that employment growth is increasing (decreasing) nationally. Not surprisingly, one also observes that the (seasonally adjusted) unemployment rate in the District exhibits the same pattern as the national unemployment rate. In fact, from 1981 until the early 1990s, differences in the two rates were difficult to detect. From the early 1990s to the present, the two rates have exhibited a similar pattern; however, the District’s unemployment rate has tended to remain below the nation’s rate. For example, the rate for June 2002 was 4.7 percent in the District and 5.9 percent for the nation.
County Unemployment Rates
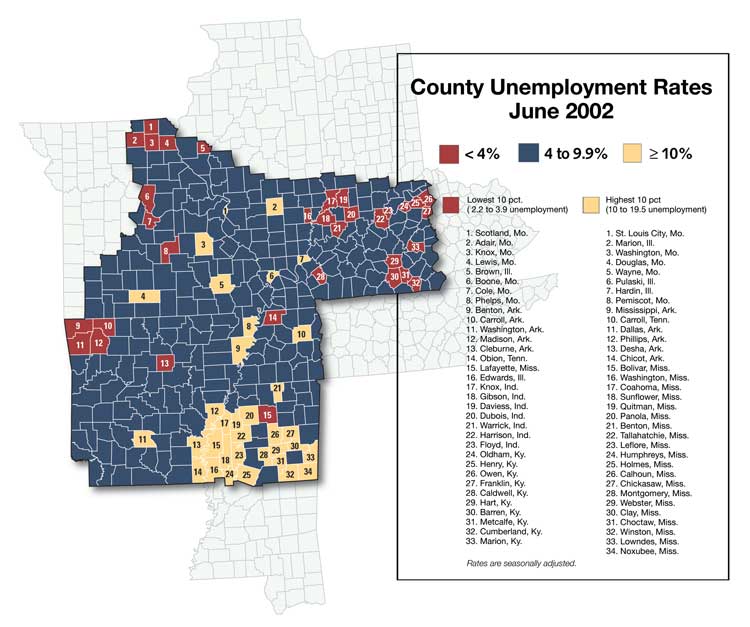
Somewhat obscured by the District unemployment rate are large differences in unemployment rates across counties. For example, rates in June 2002 ranged from a low of 2.2 percent in Benton County, Ark., to a high of 19.5 percent in Webster County, Miss. The map, which highlights the 10 percent of the District’s counties with the highest and lowest unemployment rates, shows that counties with the relatively high rates in the District tend to be clustered in Mississippi. Low-unemployment counties tend to be scattered in pockets throughout the District.
An important question is whether a low (high) unemployment rate county tends to remain a low (high) unemployment rate county over time. Generally, the answer is yes. For example, using the troughs of the most recent national business cycle—March 1991 and February 2002—the correlation of county unemployment rates was 0.68.1 Therefore, a county with a relatively low (high) unemployment rate in March 1991 was also likely to be a relatively low (high) unemployment rate county in February 2002. Of the 34 counties with the lowest unemployment rates in March 1991, 22 of these counties were among the lowest in February 2002. Of the 34 counties with the highest rates in March 1991, 18 counties were among the highest in February 2002.
Looking Ahead
When growth accelerates sufficiently —sometime in the next 12 months—national employment growth will speed up, as will employment growth in the District. When the unemployment rate nationally begins to decline, the District should experience a similar decline. However, despite the declines in the District, one will still see large differences in unemployment rates across counties.
Patterns in the District Labor Market
Endnotes
- The precise month of the most recent trough has yet to be identified; however, most analysts agree it occurred during the first quarter of 2002. [back to text]

Views expressed in Regional Economist are not necessarily those of the St. Louis Fed or Federal Reserve System.
For the latest insights from our economists and other St. Louis Fed experts, visit On the Economy and subscribe.
Email Us