


Enhancing Future Retirement Income through 401(k)s
With the retirement of the baby boom generation slated to get under way in about a decade, retirement issues are beginning to take center stage. Because Americans are living longer and retiring earlier, the number of years spent in retirement is also increasing. This means that the future strain on Social Security and Medicare—the two large public retirement programs that most elderly people rely upon a great deal—might be considerable. An additional uncertainty is the fact that the share of workers deriving their primary form of retirement income from traditional pension plans—also an important source of funds—continues to fall. Perhaps in response to these uncertainties, more and more people are beginning to supplement their retirement income through additional means, such as 401(k) savings plans.
Shades of Gray
Under current law, individuals can take early retirement at age 62. Thus, the first influx of baby boomers—those born between 1946 and 1964—beginning to draw Social Security and Medicare benefits will commence in 2008. When the last of the boomers reaches normal retirement age (67) in 2031, it is estimated that one-fifth of the U.S. population will be 65 or older (hereafter "the elderly"), compared with about 12 percent currently.1 This graying of the population, which most other industrial countries also face, has spawned countless reports and studies that attempt to quantify its potential long-term economic effects. One such report is the Congressional Budget Office's annual Long-Term Budgetary Pressures and Policy Options. In the 1998 edition, the CBO estimates that, with no change in tax rates or benefits, the federal debt held by the public will reach an unprecedented 206 percent of GDP by 2050—nearly double the 122 percent at the end of World War II. Measured against this yardstick, the retirement of the baby boom generation has the potential to be a much greater financial commitment than World War II ever was.
Regardless of whether these forecasts are accurate, the dilemma facing the nation is stark: Americans are living longer, retiring earlier but saving less. A person born in 1997 can expect to live a little more than 76 years—about a dozen years more than someone born in 1940 and nearly 30 years more than someone born in 1900. In addition, an increasing proportion of the average American's life span is spent in retirement. In 1960, for example, only 10 percent of eligible workers took early retirement at age 62; by 1995, this percentage had jumped to just over 58 percent. As a result, the average retirement age dropped—from 70 in 1945 to about 64 in 1995 (see chart).
Average Retirement Age and Life Expectancy at Age 65 and Birth
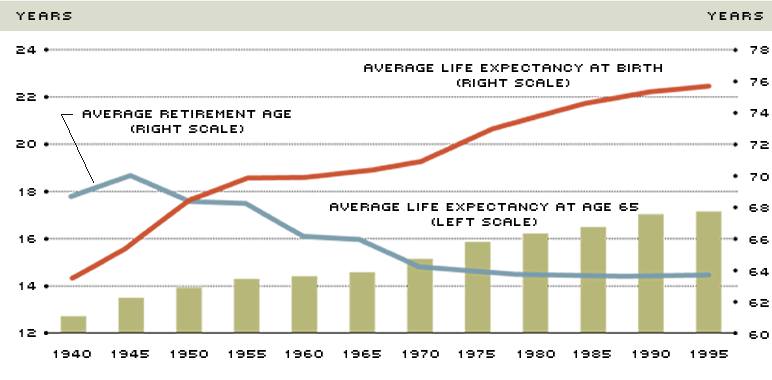
SOURCE: Social Security Administration
This widening gap between retirement age and average life expectancy presents a host of problems for businesses, policy-makers and retirees themselves. For businesses, the problem is potentially quite serious: how to pay for the health and pension benefits due to an increasing number of retirees without sacrificing equally important obligations, such as new product development, capital expenditures or workforce training. Policy-makers face a similar dilemma: how to fund a retirement system that was designed at a time when the average retirement age exceeded the average life expectancy at birth.
Compounding this problem, the number of workers drawing benefits will soon start increasing much faster than the number of workers paying into the system. In 1950, the ratio of the working age population (20 to 64) to retirees (65 and over) was a little more than seven; by 2030, it is expected to be about three. The economic consequences of this demographic shift are potentially enormous for both future workers and retirees.
Can Social Security Shoulder the Load?
According to the 1998 annual report of the Social Security Trustees, the cost of the program is projected to exceed revenues by $700 billion (best case scenario) to $19.9 trillion (worst case scenario) in 2075. A middle-of-the-road projection—what the trustees call an intermediate cost estimate—pegs this unfunded liability at about $7 trillion. But when the estimated future costs of the Hospital Insurance program for the elderly and disabled (Part A of Medicare) are included, this shortfall rockets to between $2 trillion and $38.5 trillion, with an intermediate estimate of $13.2 trillion. In relation to the projected size of the U.S. economy—which is a better measure—this amounts to an unfunded liability of between 0.8 percent and 10 percent of GDP, with an intermediate estimate of 4.25 percent.2
All else equal, an increasing ratio of retirees to workers means a lower standard of living for the nation than might otherwise be the case. Of course, this future reduction in living standards could be offset by an increase in worker productivity. Accordingly, unless the economy grows much faster than projected, closing this gap will require a combination of reduced benefits and higher tax rates. Indeed, some economists estimate that, without a reduction in current benefits, those born in 1995 will face a lifetime net tax rate of 50 percent—much higher than the 33 percent faced by those born in 1960.3 Therefore, to maintain a minimum standard of living during retirement, many Americans will have to accumulate enough income-earning assets during their working years to offset any reduction in Social Security benefits. This is important because benefits received from the Social Security program comprise the largest source of income—40 percent in 1996—for those 65 and older.4
But if government projections are accurate, there is a good chance that Social Security's share will shrink even more in the future. Three additional sources of retirement income that could offset this loss are: continued employment, personal assets and employer-provided pensions.
Save Today to Spend Tomorrow
Although the percentage of people retiring early continues to increase, many elderly people still continue to work for pay during their retirement years. In fact, employment earnings comprise nearly a fifth of all income for those 65 and older. At some point, however, this share begins to diminish, and seniors must rely on other sources of retirement income.
For most Americans, the amount of money saved for retirement is directly proportional to the amount of money not spent. For economists, though, saving is best defined as the act of foregoing consumption today in order to consume more tomorrow. In other words, future consumption is financed by an increase in wealth accumulated over an individual's life span. Ample retirement income, then, depends importantly on the amount saved.
During the 1950s, '60s and '70s, most Americans seemed solidly committed to saving for retirement, judging by the 9 percent or so U.S. household (or private) saving rate. More recently, however, this commitment seems to have faltered: Households ratcheted up their rate of spending in the 1980s and '90s, leaving their saving rate at an average of just 2.1 percent during 1990-94—less than half the 4.7 percent logged during the 1980s.5 There is some evidence, however, that Americans may be starting to save more: Between 1995 and 1997, the private saving rate rose from 3.4 percent to about 5 percent—the highest since 1984. Although this reversal may be only temporary, it could also be that boomers, knowing the financial problems surrounding the Social Security and Medicare programs, have finally realized they need to start saving more for retirement.
Another possible reason for the savings uptick may be the waning importance of employer-provided pensions, otherwise known as defined benefit (DB) plans. A DB plan is essentially a lifetime annuity purchased by the employer for the employee. This means that, at retirement, the employee receives a fixed-dollar benefit for life that may be a lump-sum payment or simply a monthly payment for the remainder of the employee's life. Either way, this benefit is typically based on such factors as years of service and the employee's average salary over, say, the last three to five years. In 1996, pensions of all kinds comprised 19 percent of retirement income for seniors, nearly equal to the share of income derived from earnings (20 percent).
As with Social Security benefits, though, future retirees may also come to depend less on pension income. How can this be when the number of private retirement plans (including DB plans) more than doubled—to just over 690,000—between 1975 and 1994? The reason is that the number of DB plans actually fell about 28 percent—to around 74,500. As a result, the percentage of workers (participation rate) whose primary form of pension coverage is a DB plan dropped from about 40 percent in 1975 to just under 25 percent by 1994.6 Accordingly, the share of workers participating in other types of retirement plans is increasing. Just what type of plans are these that more people are participating in?
401(k) Plans to the Rescue?
With household saving rates starting to inch upward, it appears workers have concluded that traditional forms of retirement income are expected to be proportionately smaller in the future. And a good chunk of this increased saving seems to be going into income-earning assets that are invested in financial instruments like stocks and bonds. In this way, then, workers are maintaining—and perhaps enhancing—their future consumption by accumulating more personal assets. One of the most popular ways this is being accomplished is through 401(k) retirement plans.
The 401(k), which was made available to the public in 1982, is not considered to be a traditional pension plan. Rather, it is one of several types of defined contribution (DC) plans; among these are profit sharing plans and employee stock-option plans (ESOPs). Defined contribution plans allow employees to voluntarily contribute a percentage of their earnings to an investment account, such as a mutual fund. Whereas 401(k) plans are mostly for private industry workers, a similar arrangement is available for employees of state and local governments and nonprofit organizations or educational institutions. These are respectively known as 457 and 403(b) plans.7
Pros
The 401(k) plan is beneficial to employees for several reasons. First, employee contributions are made on a pretax basis. If an individual makes $50,000 a year and contributes 6 percent of this to a 401(k) plan, his taxable income would be reduced by $3,000; that is, instead of paying taxes on $50,000, he would pay taxes on $47,000. At a marginal tax rate of 28 percent, then, he would lower his taxes by $840.8 Second, most employers match a fixed percentage of the employee's contribution. A common arrangement is one in which the employee contributes 6 percent of his salary, with the employer matching 50 percent of that contribution. Depending on the plan, the employer's match is either in cash or in company stock. To build on the previous example, if an employee contributes $3,000 a year (6 percent of his salary), the employer would contribute an additional $1,500. In effect, then, the employee receives an extra 3 percent in compensation just by participating in the plan.
Another benefit is that investment income accumulates on a tax-free basis until retirement. When the employee retires, he can arrange to receive a lump sum payment (current or deferred), or, as with a DB plan, an annuity that provides a fixed income based on the employee's cumulative account balance. These distributions are taxed as regular income at the retiree's marginal tax rate; therefore, taxes are deferred, but not avoided. Another advantage is that plan participants can alter the composition of their account balance if market conditions warrant it, without incurring a capital gains tax. Currently, about three-fourths of all 401(k) plan participants have this option—something DB plan participants do not.
Another important advantage is that, unlike many DB plans, 401(k)s also offer employees better protection against inflation. The reason is that (on average) financial assets like stocks and bonds offer a rate of return that exceeds inflation. Finally, should the employee leave his job before retirement, he can roll over his 401(k) account balance into an Individual Retirement Account (IRA). Employees can also borrow against their 401(k) plans and withdraw funds for certain necessities or hardships.
Cons
There are also a few drawbacks to the 401(k) retirement plan. For starters, unlike a traditional DB plan, a defined contribution plan does not guarantee a minimum benefit (that is, a pension that stipulates a fixed dollar amount). Therefore, unless an employee is also covered by a DB plan—about 20 percent of all private sector employees participated in both types of plans in 1995—a significant percentage of his total retirement income may depend on how much he saves. Secondly, the gains from tax-deferred contributions are taxed at the employee's marginal tax rate when withdrawn. Depending on the employee's tax bracket, this rate could be much higher than the capital gains tax rate.
Finally, because most 401(k) plan participants are allowed to choose how their contributions are invested, those employees with a limited knowledge of how financial markets work may earn a relatively lower rate of return over time—they may even end up with an account balance smaller than the sum of their lifetime contributions. Of course, employees who are better informed about financial market conditions may benefit from such an arrangement. Either way, though, the onus is on the employee to ensure himself a sufficient level of retirement income by saving a minimum percentage of his earnings, and, if possible, investing this saving in assets that earn a sufficient return over time.
Participation Rates and Plan Balances
The share of workers enrolled in DC plans rose from roughly 15 percent in 1975 to 37 percent in 1994. Over this same period, participation rates in DB plans fell from 39 percent to 24 percent. Most of the increase in DC participation rates stems from a rise in the popularity of 401(k) plans. In fact, about 70 percent of workers eligible to participate in 401(k) plans do so. Still, the percentage of the workforce participating in 401(k) plans—although rising—is far less. As shown in the table, the overall participation rate in 401(k) plans rose from a little less than 9 percent in 1984 to nearly 25 percent in 1994.
401(k) Retirement Plan Statistics: They Don't Lie
(Selected Years)
| Years | Number of Plans | Active Plan Participation Rate | Total Assets ($ Billions) |
Average Account Balance |
|---|---|---|---|---|
| 1984 | 17,303 | 8.7% | $91.8 | $12, 169 |
| 1986 | 37,420 | 12.8 | 182.8 | 15,813 |
| 1988 | 68,121 | 16.4 | 277.0 | 18,220 |
| 1990 | 91,614 | 20.6 | 384.9 | 20,593 |
| 1992 | 139,704 | 23.2 | 553.0 | 24,681 |
| 1994 | 174,945 | 24.9 | 674.7 | 26,767 |
| 1998 (projected) | 441,381 | 37.2 | 1,498.6 | 36,690 |
NOTE: Plan participation rate is calculated as a share of the private-sector workforce. Projections for 1998 are based on annual compound growth rates for 1984-94. Some workers are covered by both defined benefit and defined contribution plans.
SOURCE: Private Pension Plan Bulletin (Spring 1998), U.S. Department of Labor
With rising participation rates, the value of assets in 401(k) plans has risen as well—from about $92 billion in 1984 to roughly $675 billion in 1994. By 1994, assets in 401(k) plans accounted for almost two-thirds of the $1.1 trillion assets in all DC plans. Accordingly, the average account balance of 401(k) plan participants has also steadily increased over time—rising from just over $12,000 in 1984 to nearly $27,000 in 1994. During this same period, the average holding of household assets increased somewhat less, 75 percent. Thus, since 1984, it appears that an increasing share of household assets are comprised of 401(k) account balances.
Analysis of developments that have taken place since 1994 is limited because official participation rate data are available only with a considerable lag. That said, given steadily increasing participation rates and a sharp increase in the number of plans, it seems reasonable to believe that these trends carried through into 1998. Simple projections based on these assumptions show a participation rate of a little more than 37 percent in 1998, with 401(k) assets at about $1.5 trillion and the average account balance at nearly $37,000.
These projections, which are not true forecasts, are admittedly simplistic. Still, the overall return on stocks that comprise the S&P 500—which measured 38 percent in 1995, 23 percent in 1996 and 33 percent in 1997—suggests that these projections are not wildly out of bounds, either. In fact, they may be understated somewhat. Although the comparison is merely approximate, Federal Reserve Flow of Funds data indicate that average household financial assets holdings rose by an estimated 50 percent from 1994 to 1997. This increase exceeds the 37 percent projected gain in average 401(k) account balances over the four-year period between 1994 and 1998 (see table).
Ultimately, however, simple projections do not work well in forecasting the future. After all—extended far enough into the future—projections based on past growth rates would show 401(k) participation rates eventually exceeding 100 percent, which is obviously not possible. It is possible, however, to project future account balances based on current participation and contribution rates, average 401(k) account balances, and historic rates of return on stocks and corporate bonds. A recent academic study along these lines indicates that an individual who was 37 in 1996 could amass a 401(k) account balance of just over $91,600 by age 65, while someone 10 years younger would end up with a balance of more than $125,500 (both in 1992 dollars).9
The projections for both age groups assume that the individual is investing half of his contribution in stocks and half in corporate bonds. But if the individual invested all of his contributions in stocks, it would increase his overall lifetime returns, producing an account balance (or wealth) of $181,600 for the 37-year-old and $256,000 for the 27-year-old. Conversely, investing in lower-risk corporate bonds would produce account balances of about $50,100 and $66,750, respectively, by retirement age.
How do these 401(k) projections stack up to projected Social Security benefits? Assuming current benefit rates, the accumulated Social Security wealth (balance) of each age group would average about $104,000 at age 65. Thus, depending on his investment choices, by the time the average 37-year-old (in 1996) turns 65, his 401(k) wealth could range from as much as 50 percent of his total Social Security wealth to 76 percent more than his accumulated Social Security wealth. For the 27-year-old, the ratio of 401(k) wealth to Social Security wealth would be between 65 percent and 150 percent. Since the future level of Social Security benefits is in doubt, the overall importance of 401(k) plans is probably understated. In addition, both age groups could end up with considerably higher 401(k) balances by age 67 (normal retirement age by 2022). In any case, it seems clear that future retirees, unlike those of today, will derive a significantly greater proportion of their income from 401(k) retirement plans.
Long-Term Concerns
An increasing share of workers are contributing to 401(k) retirement plans that hold financial assets like stocks and bonds. As a result, the exposure many Americans now have to financial market developments is probably greater than before. Certainly, this increased exposure entails a degree of risk many would prefer not to accept. Others, however, recognize that with risk comes reward: The average return on stocks (equities) is much higher over time than less risky financial investments like U.S. government bonds (Treasury securities). This may be a double-edged sword, however, since the demographic trends that are threatening Social Security and Medicare benefits for future retirees might also bode ill for the economy as a whole. If so, those invested in the stock market—including 401(k) plan participants—would also be adversely affected.
For better or worse, it looks increasingly likely that the share of retirement income from personal assets will be much higher for tomorrow's retirees than for today's. Therefore, policy-makers interested in reforming the public pension system would be wise to consider the potential useful contribution that 401(k) plans can make. More important, they must be increasingly watchful of policies that could threaten future economic growth and, thus, overall financial market returns. If not, the retirement prospects of many Americans may be adversely affected.
Endnotes
- Beginning in 2000, the normal retirement age will increase two months a year until 2022, when it reaches 67. [back to text]
- According to trustee estimates, there will be a surplus of a little less than 0.5 percent of GDP in 1998. [back to text]
- See Gokhale (1998). [back to text]
- For about a third of the elderly, Social Security provides between 90 percent and 100 percent of their income. Another third or so depend on Social Security for less than half their income. See Social Security Administration (May 1998). [back to text]
- The household (private sector) saving rate used here is the share of net private sector output (net national product, less government) that remains after consumption and government spending is accounted for. See Gokhale, Kotlikoff and Sabelhaus (1996). [back to text]
- Defined benefit plans are still the dominant type of pension plan in the public sector; more than 90 percent of all public sector employees are covered by them. The move away from DB plans has been in the private sector. [back to text]
- See EBRI (1997). [back to text]
- The savings would be somewhat less since Social Security (FICA) taxes on 401(k) contributions are not deferred. [back to text]
- See Poterba, Venti and Wise (1997). [back to text]
References
Board of Trustees, Federal Old Age and Survivors Insurance and Disability Insurance Trust Funds. 1998 Annual Report of the Board of Trustees of the Federal Old Age and Survivors Insurance and Disability Insurance Trust Funds, Washington, D.C. (April 28, 1998).
Congressional Budget Office. Long-Term Budgetary Pressures and Policy Options, A Report to the Senate and House Committees on the Budget (May 1998).
Employee Benefit Research Institute. Fundamentals of Employee Benefit Programs, Fifth Edition (1997).
Gokhale, Jagadeesh. "Generational Equity and Sustainability in U.S. Fiscal Policy," Economic Commentary, Federal Reserve Bank of Cleveland (April 15, 1998).
_______, Laurence J. Kotlikoff, and John Sabelhaus. "Understanding the Postwar Decline in U.S. Saving: A Cohort Analysis," Brookings Papers on Economic Activity (1:1996), pp. 315-407.
Poterba, James M., Steven F. Venti, and David A. Wise. "Implications of Rising Personal Retirement Saving," NBER Working Paper 6295 (November 1997).
Social Security Administration. Income of the Aged Chartbook, 1996, Office of Research, Evaluation and Statistics (May 1998).
U.S. Department of Labor. Private Pension Plan Bulletin, Pension and Welfare Benefits Administration (Spring 1998).

Views expressed in Regional Economist are not necessarily those of the St. Louis Fed or Federal Reserve System.
For the latest insights from our economists and other St. Louis Fed experts, visit On the Economy and subscribe.
Email Us