


A Fiscal Devolution: Can State and Local Governments Measure Up?
The relationship between the federal government and state and local governments is poised to undergo a sea change. There appears to be a newfound willingness to let states and localities experiment with policies designed to alleviate many of the country's most pressing social ills—a direction in policy decidedly different than what has prevailed for the past 60 years. One current proposal would let state and local governments decide how best to implement many federal welfare programs. Under this proposal, states would receive a fixed amount of money, called block grants, with few strings attached on how they spend this money. Under current law, by contrast, states receive federal revenues under a matching program based on a percentage of the total amount that they spend on these programs.
Buttressing this devolutionary undercurrent is an effort by Congress and the administration to eliminate the federal budget deficit within the next seven years. Although there remains some disagreement, the reordering of federal budgetary priorities is an important element that states must factor into their fiscal planning horizon. Can state and local governments handle their share of the heavy lifting necessary to accomplish these goals?
A Primer on Government Finances
Government finance concerns the borrowing, taxing and spending mechanisms at the federal (Congress), state (the state legislature) and local (city or county government) levels. Although federal finances receive most of the attention, most of the public services consumed by the average citizen on a day-to-day basis are provided for and financed at the state or local level: public schooling, street, sewer and highway maintenance, and police and fire protection. The federal government ensures the national defense and guarantees constitutional rights, public services that, while readily consumed by all citizens, are less visible. By the same token, the federal government also operates an elaborate social welfare system (programs like Social Security and Medicare), much of which is administered at the state and local levels.
Where the Money Comes from
As the table shows, revenues from taxes are more important to federal and state governments than they are to local governments.1 Individual income taxes represent the largest share of federal revenues, while general sales taxes and property taxes are the most important sources of revenues for state and local governments, respectively. The local governments also rely heavily on the charges and miscellaneous general revenue category, which comes from sources like airports, highways (tolls), hospitals and universities (tuition).
Where Government Revenues Come from
Percent of Total Revenues, 1991
| Federal | State | Local | ||
|---|---|---|---|---|
| Taxes | 53.5% | 47.0% | 35.1% | |
|
39.0 | 15.0 | 1.6 | |
|
8.2 | 3.1 | 0.3 | |
|
0.9 | 26.4 | ||
|
1.3 | 15.6 | 3.6 | |
|
3.5 | 7.6 | 1.6 | |
|
1.5 | 4.7 | 1.5 | |
| Charges & Misc. General Revenue | 13.9 | 14.8 | 20.4 | |
| Utility & Liquor Store Revenue | 1.0 | 8.9 | ||
| Insurance Trust Revenues | 32.3 | 15.4 | 2.6 | |
| Intergovernmental Revenue | 0.3 | 21.7 | 33.0 | |
|
20.4 | 3.1 | ||
|
0.3 | 29.8 | ||
|
1.3 | |||
| Total Revenues (Billions of Dollars) | $1,200,682 | $659,948 | $612,182 |
1 Death and gift taxes, severance and license taxes and all other taxes and receipts
NOTE: Totals may not add because of rounding error.
SOURCE: U.S. Department of Commerce, Bureau of the Census
As the table also shows, revenue from federal coffers is important to the states, accounting for a fifth of total state revenues in 1991. In similar fashion, local governments receive nearly 30 percent of their revenues from state governments; however, they receive little directly from the federal government because much of the intergovernmental aid they receive from the federal government is simply channeled through the state government.
Another large chunk of revenues for federal and state governments accrues from insurance trust taxes. At the federal level, insurance trust taxes include mostly Social Security and Medicare taxes, which account for nearly a third of total federal revenues, while at the state level these taxes are mainly for employee pensions and unemployment insurance. Insurance taxes are a relatively minor source of revenues for local governments.
Where the Money Goes
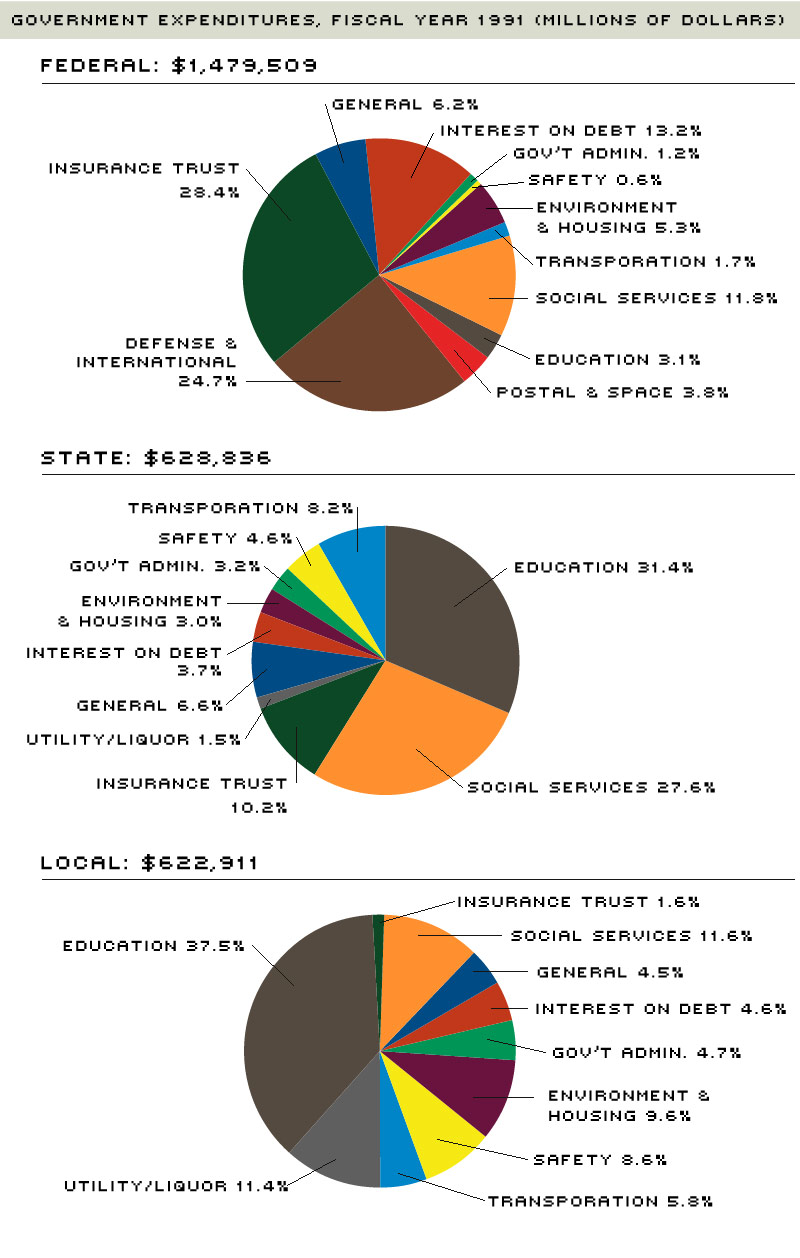
The composition of spending among federal, state and local governments also varies, reflecting their differing responsibilities. As the pie charts in Figure 1 show, state expenditures on education and social services make up more than half of total expenditures, while at the local level these two categories are nearly half. At the federal level, in contrast, spending on Social Security and Medicare (insurance trust) and defense makes up more than half of total spending. Local governments also spend proportionately more for fire, police and corrections (safety), while state governments pick up most of the tab for streets and highways (transportation). Spending on parks and recreation, housing, sewerage and solid waste management (environment and housing) is also an important local responsibility.
Recent Trends in State and Local Finances
Prior to 1969, which, coincidentally, was the last time the federal government posted a budget surplus, state and local governments usually ran budget deficits. Since then, thanks in part to revenue sharing by the federal government, state and local governments have consistently run budget surpluses. Measured as a percentage of total expenditures, these surpluses have generally exceeded 6 percent since 1972. Over the past few years, though, state and local surpluses have dwindled steadily: After reaching a 38-year high of 13.4 percent in 1984, state and local budget surpluses fell to a 16-year low of just over 2 percent in 1991.
What happened? First, the economy, which began to slow in 1989, finally slipped into a recession in July 1990. In an economic downturn, increases in unemployment lead to increases in the demand for social welfare services, boosting expenditures by more than planned. At the same time, reductions in individual and corporate incomes reduce tax receipts, thereby lowering revenues.
Second, the downsizing in the defense industry and the worsening financial imbalances in the early 1980s in California and New England real estate markets led to increasing loan defaults, reduced economic growth and lower tax revenues. Third, the federal government passed a myriad of laws and regulations that had their largest effect at the state and local level. These mandates, which run the gamut from clean air and clean water regulations, to food stamp, welfare and Medicaid eligibility requirements, imposed onerous financial burdens on state and local governments. The burden stems from the fact that most of these mandates are not federally funded—the federal government provides little or no direct revenues to offset the costs of these added burdens.
Finally, state and local governments were themselves partly to blame. Between 1983 and 1991, compensation of state and local workers outpaced that of private industry workers by an average of 1.3 percentage points per year, needlessly boosting expenditures.
Unlike the federal government, 49 of the 50 states operate under an annual balanced budget requirement. Moreover, state and local governments have restrictions on their ability to borrow money to offset operating deficits. Nevertheless, because planned expenditures are sometimes higher than expected, and planned revenues are sometimes lower than expected, most state and local governments use surpluses to build up reserves. Also known as "rainy-day" funds or budget stabilization funds, these funds are employed to help cushion possible budgetary shortfalls.
A large number of state and local governments drew these reserves down to extremely low levels in the late 1980s and early 1990s, forcing themselves to enact fiscal counter measures. According to the National Governors Association and the National Association of State Budget Officers, state governments passed tax increases totaling $4.9 billion in 1990, $10.3 billion in 1991 and $15 billion in 1992. At the same time states were raising taxes, in a slow-growth environment no less, they were curtailing their spending rates: After averaging 3.6 percent from 1984 to 1989, real state budget increases averaged 1.6 percent per year between 1990 and 1992. For policymakers, the relevant question is whether things have improved and, if so, by how much.
Have State and Local Governments Recovered?
In 1992, a record number of states—35—enacted mid-year budget cuts. By 1994, the number forced to take such action had declined to 10; for fiscal year 1995, 11 states reduced or planned to reduce their budgets. Echoing this improvement, the National Conference of State Legislatures (NCSL) reports that states' general fund reserves as a share of total expenditures are the highest in 15 years. As a result, the NCSL reports that most states are "entering fiscal year 1996 in the best shape they have been since the early 1980s."
Similar sentiments are expressed by the National League of Cities (NLC).2 In 1990, 40 percent of cities reported general fund expenditures exceeding their revenues. By 1991, this figure jumped to 49 percent. By 1994, however, only 28 percent of cities reported a fiscal shortfall, the lowest since 1984, with the largest cities (those with populations greater than 300,000) having the least difficulty.
Much of this turnaround stems from the relatively strong economic growth that has prevailed nationally over the past two years. Real gross domestic product (GDP), after rising at a meager 0.3 percent annual rate between 1990 and 1991, has since risen at a 3.5 percent annual rate, well above its long-run average. Likewise, the national unemployment rate, which rose from an average of 5.3 percent in 1989 to 7.4 percent in 1992, has fallen to below 6 percent. These developments underscore a crucial determinant of government finances: Budget positions tend to improve when economic growth is strong and vice versa. And in fact, periods in which state and local surpluses were high and rising corresponded to periods of strong economic growth nationally, as in the mid-1980s.
Another factor contributing to the turnaround in state and local finances is the diminishing rates of state and local budget increases from a decade or so ago. Real state budget increases between 1992 and 1994 averaged 1.6 percent a year, a far cry from the mid-1980s, when they were more than double this amount. In fiscal year 1995, state budgets are projected to increase an inflation-adjusted 3.4 percent but then decline 0.7 percent in 1996, which would be the first decline since 1983. As a result, year-end general fund balances (rainy day funds available for unforeseen circumstances) as a percent of expenditures in 1995 are projected to be 5.2 percent, the same as in 1994, but substantially higher than 1.1 percent in 1991. In fact, year-end balances are projected to be the highest they have been since 1980 (9 percent).
Improved financial positions have led many states to enact multi-year tax cuts. In 1995, such cuts are expected to reduce revenues by $2.6 billion from their 1994 levels; in 1996, with at least 28 states proposing tax reductions, revenues are projected to decline an additional $3.4 billion. If this situation holds, state revenues will have declined for two years in a row because of tax reductions for the first time since 1979-80. Meanwhile, several states are proposing to limit future tax increases through voter referendum initiatives or efforts to make it harder for state legislatures to enact tax increases.
Storm Clouds on the Horizon
Despite the states' relatively robust fiscal health, recent trends in the composition of spending and revenues suggest a potential long-term problem, one that has been building for quite some time and that largely reflects trends in federal spending. Recall from the table that a substantial portion of a state's revenues comes from the federal government in the form of grants-in-aid or transfers. Most of the remainder is derived from its general fund revenues, which are received from a broad base of state taxes and are the primary way a state finances its operations. In 1994, general fund revenues accounted for slightly less than half of total state revenues. Federal funds were slightly more than a quarter of the total, with other state funds like excise taxes accounting for close to another quarter. Since 1987, though, states have relied less on general fund revenues, while increasing their reliance on revenues from the federal government. This can present potential long-term problems.
Some of this is not their doing. Beginning in 1987, federal policymakers reversed a decade-long trend of fewer dollars transferred to state and local governments. After doling out 9.6 percent of its total expenditures in grants-in-aid to states and localities in 1987, the federal government upped its contribution to 12.8 percent in 1994, the highest percentage since 1980. By increasing their reliance on federal revenues, state and local governments may one day find themselves in a situation in which their expenditure commitments exceed their expected revenues, should the federal government decide to send fewer dollars their way.
Medicaid expenditures are another reason why federal funds have become increasingly important to states.3 Between 1970 and 1987, Medicaid expenditures rose from about 4 percent of state expenditures to more than 10 percent. Seven years later, this share had risen to almost 20 percent. Thus, the share of state funds allocated to Medicaid expenditures has increased roughly five-fold in the past 25 years.
The states do not, however, pickup the entire tab for Medicaid expenditures. The federal government's share of each state's Medicaid spending ranges from 50 percent to 80 percent. Despite this assistance, Medicaid spending by the states has mushroomed at the expense of other spending. For example, Medicaid spending has risen from just over 8 percent of general fund spending in 1987, to 13.3 percent by 1994. There appears to be little indication that this pattern is abating. According to a recent NCSL survey, Medicaid expenditures rose an estimated 10 percent in fiscal year 1995, significantly higher than the budgeted increase of 7.2 percent; for 1996, Medicaid expenditures are projected to increase 9.5 percent. Although some of this is a demographic phenomenon—that is, an aging population—a significant part can be placed at the footsteps of the federal government.
As states were devoting more resources to Medicaid, education expenditures (elementary and secondary, plus higher education) as a share of general fund expenditures fell from 49.7 percent in 1987 to 46.7 percent in 1994. The federal government has not helped to offset this decline: The amount it contributed to state education expenditures declined from almost 18 percent of total states pending in 1987 to more than 12 percent in 1994. As the NCSL reports, although many states attempted to counter this trend in 1995 by boosting general fund spending for elementary and secondary education by more than planned, actual general fund spending on higher education was lower than its budgeted increase. For 1996, the share of general fund outlays devoted to education is expected to be little changed from 1995.
Similar trends are evident for spending on transportation and cash assistance (welfare). One exception is outlays for corrections. The NCSL reports that corrections is the fastest growing component of state spending in recent years, with an increase of 11.1 percent expected in 1995, and an increase of 13.3 percent projected for 1996.
Rays of Sunshine
Clearly, if states continue to devote an increasing share of their resources to Medicaid, then they must—in the absence of increased revenues—devote fewer resources to education, highways or other programs (see Figure 2). Recognizing this, several states have initiated their own Medicaid reforms. For example, Kentucky has tried to reduce Medicaid outlays by requiring recipients to enroll in a managed care system, as well as by implementing other cost containment mechanisms like increasing deductibles and copayments. Tennessee has instituted a similar system.4
At the national level, current proposals to reform Medicaid and Medicare take a similar approach, offering states increased flexibility. In addition, some members of Congress have dusted off the unsuccessful 1983 Reagan administration proposal to assume the state's cost of Medicaid expenditures in return for the state's assuming the federal government's cost of the Aid to Families With Dependent Children (AFDC) and food stamp programs. Regardless of whether this proposal passes muster with Congress, most policymakers recognize that double-digit yearly percentage increases on entitlement programs like Medicaid, Medicare and AFDC are not only unsustainable, but are coming at the expense of other programs. The Congressional Budget Office projects that under current policies, and with an aging population, spending on mandatory programs like Medicare, Medicaid and AFDC is estimated to rise from its current 55 percent of total federal outlays in 1995 to 62 percent by 2005.5 Meanwhile, spending on discretionary programs like defense, higher education or federal grants to state and local governments for mass transit is forecast to fall from 36 percent of total federal expenditures to 26.3 percent by 2005. Despite rhetorical flourishes that suggest otherwise, there is a broadening consensus that many of the patterns that have increasingly worsened budgets at all levels of government must be changed accordingly.
State and Local Spending on Education and Health and Social Welfare
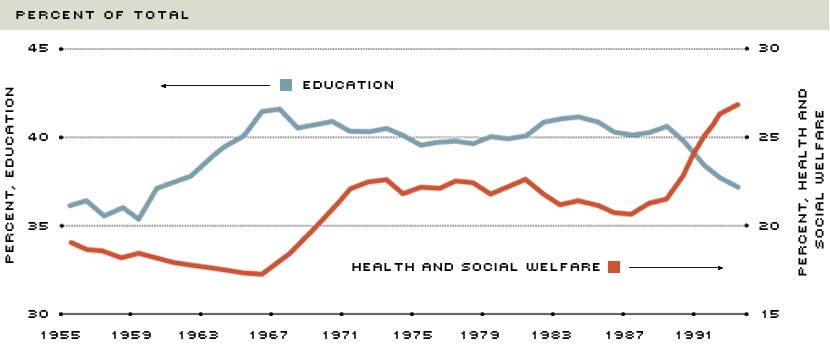
The pattern of states devoting increased resources to Medicaid and other social welfare programs and fewer resources to education is shown in the chart above. Spending on health and social welfare jumped from just under 21 percent in 1988 to nearly 27 percent in 1993. During the same period, the share of resources devoted to education fell from just under 41 percent to less than 38 percent. Over a longer horizon, the pattern still holds—particularly since 1966.
NOTE: Health and social welfare spending is comprised of expenditures for health and hospitals, income support, employment, employment security and welfare. Because of data limitations, local expenditures have also been added.
SOURCE: Bureau of the Census
Recent Trends in Local Finances
Comprehensive data at the local level is available only with a considerable lag. To compensate for this, the NLC conducts an annual survey of the fiscal conditions of several hundred cities including most of the major ones.6 According to the NLC, city governments have improved their general fund balances since 1990 and 1991. Per capita general fund balances in 1994 were nearly 25 percent of expenditures, the highest since 1989 and substantially higher than the 20.7 percent registered in 1992.
Unlike the states, few city governments have been in a tax-cutting mood, preferring instead to bolster their rainy day funds. Nevertheless, while nearly 70 percent of all surveyed cities raised taxes or fees during 1994, the amount of new revenue collected ($721 million) was the smallest in four years and was down considerably from the $3.5 billion collected in 1991.
City governments project some deterioration in their general fund balances in 1995, as revenues are forecast to increase only 2 percent, with expenditures projected to rise 6 percent. As a result, ending general fund balances are forecast to fall to 21.3 percent. This projection, though, reflects the rather conservative budgeting practices of city governments, which in recent years have routinely overestimated their expenditures and underestimated revenues. For example, while the average budgeted increase in general fund expenditures from1987 to 1994 was 5.6 percent, the actual increase was 5.1 percent. Budgeted revenue increases averaged 4.2 percent over this period, but the actual increases were 5.3 percent per year. Thus, the discrepancy between actual and budgeted ending general fund balances in recent years has been significant: From 1987 to 1994, the average expected ending balance as a percent of expenditures was 19.7 percent, while the actual ending balance was 24 percent.
Finally, to reduce costs further and improve efficiency, city governments have been increasingly willing to enter into cost-sharing agreements with other city or county governments or privatize services. As the NLC reports, nearly three-quarters of the largest cities contracted out at least one service in the past year, while half of them engaged in some form of inter local agreements. While larger cities pursued this route, small- and medium-size cities were more likely to reduce employment, in an effort to pare expenditures.
Conclusion
State and local finances appear to be in good shape, especially when compared with a few years back. As a result, several states are implementing, or planning, tax cuts. Much of this improvement can be attributed to strong U.S. economic growth, the restraint of budgets over the past few years and innovations to reduce costs and improve efficiency.
Despite these positive developments, states have increasingly relied on federal funds to finance their expenditures. Although some of this represents a policy change at the national level, it is also the result of an increasing share of resources allocated to programs like Medicare, Medicaid and AFDC. Given the widespread consensus for letting states try new and innovative programs, combined with the recent Congressional resolution to eliminate the federal budget deficit in seven years, states would perhaps be wise to plan for fewer federal dollars in the near future. While perhaps disconcerting, states will also probably have fewer constraints on how to spend those dollars and—more important—how much to spend. As a rule of thumb, though, prudent reforms by federal, state and local policymakers to rein in double-digit spending increases for mandatory social programs, combined with sound macroeconomic policies that promote strong growth, is a recipe for continued financial health at all levels of government.
Endnotes
- Unless noted otherwise, years will refer to fiscal years. The fiscal year for the federal government begins on October 1, whereas the fiscal years for 46 of the 50 states begins in July. Figures in the table and chart are for 1991, the last year that data are available for all three levels of government. [back to text]
- See Pagano (1995). [back to text]
- Medicaid is a joint federal-state program that provides medical benefits chiefly to low-income individuals, including the elderly, blind and disabled. Each state is responsible for administering its own program, subject to minimum federal eligibility guidelines, but each state also has some discretion as to who can qualify. [back to text]
- See Zaretsky (1995). [back to text]
- See Congressional Budget Office (1995). [back to text]
- The National League of Cities, unlike the National Governors Association or the National Association of State Legislatures, use data on a per capita basis. Of the 408 cities surveyed, 309 had populations less than 100,000. [back to text]
References
Bureau of the Census. "Government Finances: 1990-91," United States Department of Commerce, Economics and Statistics Administration (November 1993).
Congressional Budget Office. "The Economic and Budget Outlook: An Update," The Congress of the United States (August 1995).
National Association of State Budget Officers. "1994 State Expenditure Report" (April 1995).
National Conference of State Legislatures. "State Budget and Tax Actions 1995: Preliminary Report," News Release (July 1995).
National Governors Association and the National Association of State Budget Officers. "The Fiscal Survey of States" (April 1995).
Pagano, Michael A. "City Fiscal Conditions in 1995," National League of Cities (June 1995).
Zaretsky, Adam M. "Revamping Medicaid: One State's Attempt at Reform," The Regional Economist (April 1995), pp. 12-13.

Views expressed in Regional Economist are not necessarily those of the St. Louis Fed or Federal Reserve System.
For the latest insights from our economists and other St. Louis Fed experts, visit On the Economy and subscribe.
Email Us