Gender Pay Gap May Be Linked to Flexible and Irregular Hours
Although women’s educational attainments are increasingly surpassing men’s in the U.S. and although women’s representation in professional occupations is on the rise, there is still a gender pay gap, even within occupations. Recent research suggests that the gap exists because women tend to choose jobs that offer more-flexible hours than those chosen by men and that these jobs typically pay less than jobs with longer and more rigid hours.1 In order to further understand the gender differences in different aspects of employment, this article explores the changes in patterns of flexibility in hours of men and women from 1993 to 2015.
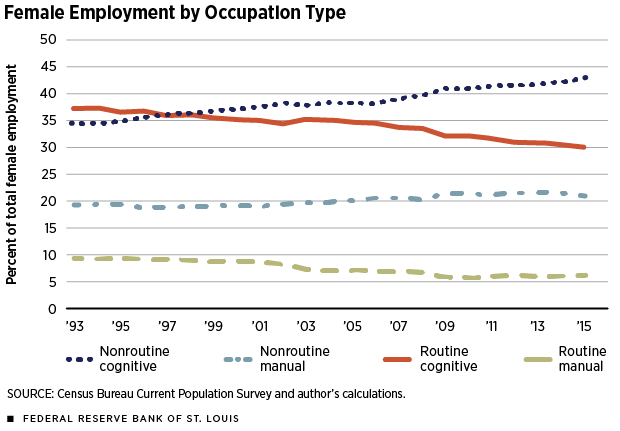
To get an idea of changes in the patterns of types of jobs women sort into, we started off by analyzing data from the Current Population Survey (CPS) for the period 1993-2015. Figure 1 presents the changes in female employment by category of work. We grouped types of work into four categories based on the tasks performed in each one. The categories are nonroutine cognitive, which includes professional occupations, management, business and financial; routine cognitive, which includes sales, office and administrative work; nonroutine manual, which is a broad category that includes service; and routine manual, which includes construction and mining, installation, maintenance and repair, production and transportation.
As the figure shows, employment of women in nonroutine cognitive occupations increased from 34 percent in 1993 to 43 percent in 2015. Employment of women in nonroutine manual occupations also increased slightly. Employment decreased in both routine manual and routine cognitive occupations.
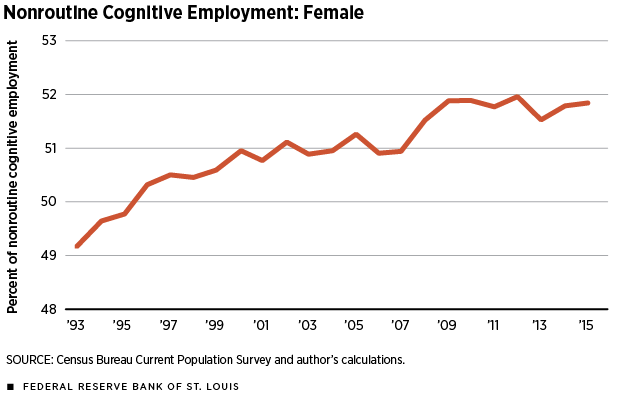
Meanwhile, Figure 2 shows the upward trend in the percentage of women working in nonroutine cognitive occupations. Men held a greater percentage of these jobs than did women until 1996, when the positions were reversed.
We also explored the trend in job flexibility by gender. The table presents changes in flexibility of hours and patterns of irregular hours due to employer and personal reasons in 1997, 2001 and 2004 by occupation category.2 While the notion of “job flexibility” is vague, intuitively job flexibility can be interpreted as having control over the timing of work.3 However, individuals were also asked whether they worked irregular hours due to personal reasons or the job requirements (employer reasons).4 Thus, one may think of the ability to work irregular hours due to personal reasons as flexibility, while working irregular hours due to employer reasons as a form of inflexibility.
The top panel of the table describes the job flexibility and irregular hours in nonroutine cognitive occupations. Overall, the fraction of women who responded “yes” to the question of flexibility of hours declined slightly from 1997 to 2004, but it increased for males. However, this picture might be incomplete because, among those who work flexible hours, there are workers who work irregular hours due to employer reasons, and among those who responded “no” to the flexibility of hours question, there are people who work irregular hours due to personal reasons.
The overall fraction of workers who worked irregular hours for both personal and employer reasons in nonroutine cognitive occupations was similar in 1997 and 2004 (although the percentage of workers who worked irregular hours due to personal reasons increased from 1997 to 2001 and then decreased, while the percentage of workers who worked irregular hours due to employer reasons decreased and then increased). Interestingly, however, only 35 percent of females who worked in nonroutine cognitive occupations in 1997 worked irregular hours for personal reasons, while 54 percent did so in 2001 and 47 percent did so in 2004. At the same time, the fraction of women in these occupations who worked irregular hours due to employer reasons declined substantially, from 65 percent in 1997 to 46 percent in 2001 and 53 percent in 2004.
Thus, women in occupations characterized by nonroutine cognitive tasks were more likely to have irregular shift schedules in 2001 and 2004 relative to 1997 due to personal reasons. One possibility is that this is a general trend driven by technological change or other employer-related changes in these occupations. If this is the case, then these patterns should also be observed for males. However, the table reveals that this is not the case. It shows that the trend is the opposite for men. Looking at the irregular work hours for men reveals that a higher proportion of men always worked more irregular hours due to employer reasons and less because of personal reasons, relative to women. The percentage of men who worked irregular hours for personal reasons declined from 34 percent in 1997 to 32 percent in 2001 and 24 percent in 2004. The proportion of men who worked irregular hours due to employer reasons increased substantially. In 1997, 66 percent of males worked irregular hours because of employer reasons, increasing to 68 percent in 2001 and 76 percent in 2004.
Since overall in the nonroutine cognitive occupations the percentage of workers who worked irregular hours for personal and employer reasons is the same in 1997 as in 2004, and since the percentage of women in these occupations went up from 45 percent to 50 percent between 1997 and 2004, the increase in irregular hours due to personal reasons of women offsets the decline in these hours worked by men. The same applies for irregular hours worked due to employer reasons: The increase for men offsets the decrease for women.
Looking at the trend in the percentage of workers having irregular hours in nonroutine manual jobs shows an overall increase in the portion of workers with irregular hours for personal reasons in 2001 and 2004 relative to 1997 and a lower fraction of workers working irregular hours for employer reasons in 2001 and 2004 relative to 1997. In routine manual jobs, there is a decrease in the percentage of workers with irregular hours due to personal reasons from 1997 and 2001 to 2004, and an increase in the fraction of workers working irregular hours due to employer reasons. These patterns hold both for males and females.
Overall, almost in all occupations in all years, a higher fraction of women work irregular hours due to personal reasons and a lower fraction work irregular hours due to employer reasons, relative to men. This might be due to more work at home for women than men and more child care responsibilities for women than men. Overall, both males and females in nonroutine cognitive occupations are less likely to work irregular hours due to personal reasons than they are in any other occupation, while the opposite is true for working irregular hours due to employer reasons. This fact holds in all years. However, as employment of women and the fraction of women in nonroutine cognitive occupations increase, there has been an increase for women in the irregular hours due to personal reasons and a decrease in irregular hours due to employer reasons.
Thus, to the extent that pay is related to the type of shifts that people work, it probably is important to further study differences in employment patterns of men and women in order to understand the persistence of the gender pay gap.
Usa Kerdnunvong provided research assistance.
Figure 1

Figure 2

Flexible and Irregular Hours for Women and Men
| Subtype of Jobs | Year | (In each year) | Gender Distribution | Flexible Hours | Irregular Hours for Personal Reasons (among those who work irregular hours) | |||||
|---|---|---|---|---|---|---|---|---|---|---|
| Percent of All Jobs | Female | Male | Percent of Female Workers | Percent of Male Workers | Percent of Total Workers | Percent of Female Workers | Percent of Male Workers | Percent of Total Workers | ||
| Nonroutine Cognitive | 1997 | 11.75 | 44.57 | 55.43 | 42.31 | 35.35 | 38.45 | 34.90 | 33.71 | 34.30 |
| 2001 | 22.29 | 49.47 | 50.53 | 39.79 | 45.31 | 42.58 | 54.46 | 32.00 | 42.39 | |
| 2004 | 19.07 | 50.38 | 49.62 | 40.67 | 47.12 | 43.87 | 46.76 | 23.94 | 34.60 | |
| Routine Cognitive | 1997 | 34.03 | 58.51 | 41.49 | 38.26 | 44.08 | 40.68 | 51.68 | 36.04 | 44.65 |
| 2001 | 23.75 | 55.51 | 44.49 | 35.70 | 36.21 | 35.93 | 58.30 | 45.01 | 52.34 | |
| 2004 | 24.23 | 56.73 | 43.27 | 38.97 | 33.44 | 36.58 | 51.26 | 52.03 | 51.56 | |
| Nonroutine Manual | 1997 | 27.39 | 45.95 | 54.05 | 32.43 | 23.42 | 27.56 | 48.64 | 45.32 | 47.12 |
| 2001 | 28.83 | 49.68 | 50.32 | 31.22 | 24.40 | 27.79 | 60.52 | 48.62 | 55.26 | |
| 2004 | 32.98 | 49.71 | 50.29 | 31.39 | 25.79 | 28.57 | 51.58 | 46.62 | 49.33 | |
| Routine Manual | 1997 | 26.82 | 19.58 | 80.42 | 18.16 | 20.55 | 20.08 | 61.78 | 40.27 | 44.08 |
| 2001 | 25.14 | 21.17 | 78.83 | 18.67 | 18.46 | 18.50 | 57.17 | 42.34 | 45.51 | |
| 2004 | 23.71 | 17.03 | 82.97 | 15.74 | 19.70 | 19.03 | 51.04 | 31.86 | 34.56 | |
SOURCES: Census Bureau Work Schedules Supplement and authors’ calculations.
NOTE: The questions regarding flexible hours and irregular hours were asked in the CPS Work Schedules Supplement, which was intermittently included in the May CPS. Therefore, we reported the results from the three latest supplements, which were in 1997, 2001 and 2004.
Endnotes
- See Goldin. [back to text]
- We present the fraction that worked irregular hours due to personal reasons; therefore, 1 minus that number is the fraction that worked irregular hours due to employer reasons. [back to text]
- In the CPS, people were asked: “Do you have flexible hours that allow you to vary or make changes in the time you begin and end work?” [back to text]
- The question on irregular hours was: “What is the main reason why you work this type of shift?”
Personal reasons included: better arrangements for child care or other family members; better pay; allows time for school; easier commute, less traffic; personal preference; other—voluntary reason; and some other reason.
Employer reasons included: could not get any other job; requirement/nature of job; other involuntary reason; and mandated by employer to meet traffic or pollution requirements. [back to text]
References
Blau, Francine D.; and Kahn, Lawrence M. “The U.S. Gender Pay Gap in the 1990s: Slowing Convergence.” Industrial & Labor Relations Review, October 2006, Vol. 60, No. 1, pp. 45-66.
Canon Maria E.; and Marifian, Elise. “Job Polarization Leaves Middle-Skilled Workers Out in the Cold.” The Federal Reserve Bank of St. Louis’ The Regional Economist, January 2013, Vol. 21, No. 1, pp. 9-11.
Gayle, George-Levi; and Golan, Limor. “Estimating a Dynamic Adverse-Selection Model: Labor-Force Experience and the Changing Gender Earnings Gap 1968–1997.” The Review of Economic Studies, 2012, Vol. 79, No. 1, pp. 227-67.
Goldin, Claudia. “A Grand Gender Convergence: Its Last Chapter.” The American Economic Review, April 2014, Vol. 104, No. 4, pp. 1,091-119.
Views expressed in Regional Economist are not necessarily those of the St. Louis Fed or Federal Reserve System.
For the latest insights from our economists and other St. Louis Fed experts, visit On the Economy and subscribe.
Email Us


