District Households Buck the Trend to Pay Down Debt
At the national level, households have decreased their debt substantially since the financial crisis of 2008. In contrast, in the Eighth District, the average household has kept debt constant. This article breaks down the total debt into five different types to uncover the differences between what’s happening at the national level vs. the District level. The main finding is that a large share of the discrepancy can be accounted for by the evolution of mortgage and home equity debt; those differences, in turn, seem related to the differences in the evolution of house prices.
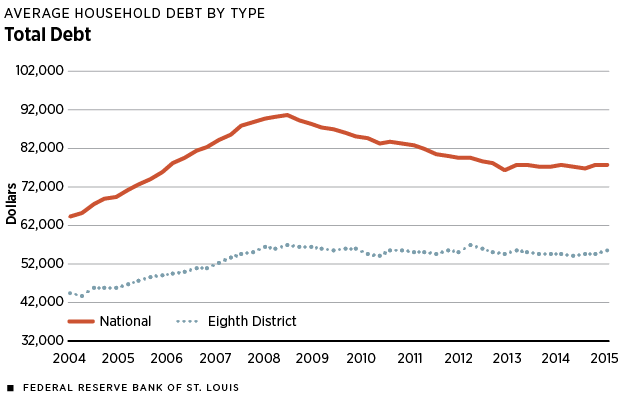
The data are from the Federal Reserve Bank of New York Consumer Credit Panel/Equifax. The first panel of Figure 1 shows the average debt for the national sample and the District sample. The average household debt in the District has been lower than the national level for the entire period shown, 2004-2015. During this time, the average household debt was $79,797 in the nation and $53,111 in the District.
More interesting are the differences in the evolution of average household debt during this period. The average household debt in the nation was $64,055 in the first quarter of 2004; it rose by 41 percent to $90,215 in the fourth quarter of 2008; it then declined by 14 percent to $77,698 in the fourth quarter of 2015. In contrast, in the District, the average household debt increased by only 28 percent, from $44,331 to $56,744, in the period 2004-2008; it then decreased only slightly, by 2.3 percent, in the period 2009-2015, reaching $55,428 in the fourth quarter of 2015.
Another way of looking at the difference is to focus on the gap in average household debt between the nation and the District. In the period 2004-2015, that gap was, on average, $26,685. That gap widened in the period 2004-2008, increasing by almost 70 percent, from $19,724 to $33,471. In the period 2009-2012, the gap shrank, decreasing by 33 percent, reflecting a sharper deleveraging in the nation than in the District. In the past couple of years, the gap fluctuated around $22,500.
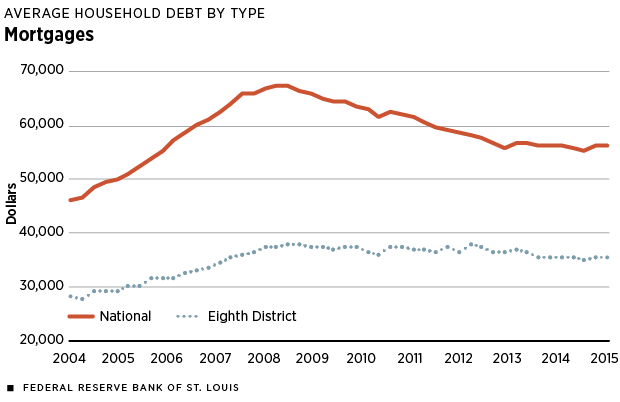
Though mortgages account for 73 percent and 66 percent of total household debt in the nation and the District, on average, we look at other types of debt because we want to understand not only the different levels of average debt but also the different evolution patterns of debt between the nation and the District.
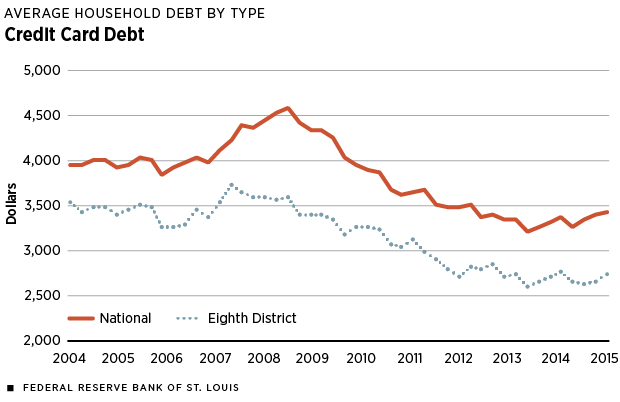
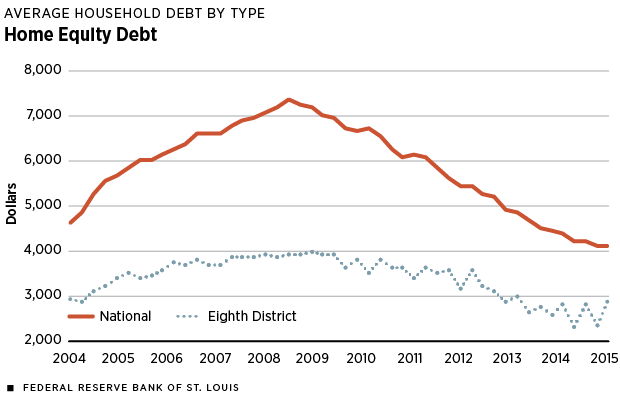
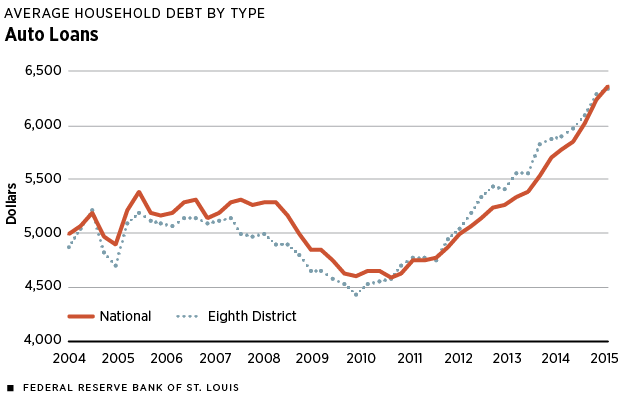
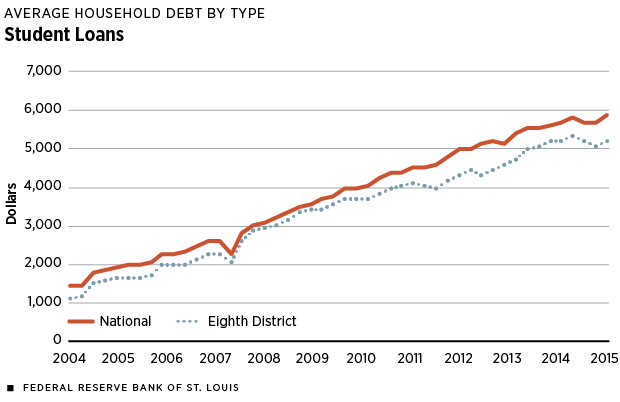
Total debt is broken down into credit card debt, mortgages, auto loans,1 student loans and home equity debt.2 The remaining five panels in Figure 1 compare the average debt for households in the nation and in the District for different types of debt:
- Credit cards: For the period 2004-2015, the average for the national sample was $3,826 and for the District was $3,159.
- Mortgages: For the nation, it was $58,897 and for the District was $35,066.
- Auto loans: For the nation, it was $5,162 and for the District was $5,111.
- Student loans: For the nation, it was $3,731 and for the District was $3,343.
- Home equity debt: For the nation, it was $5,851 and for the District was $3,393.
Thus, for all five types of debt, the average debt in the District was lower than the national average for the 2004-2015 period.
Interestingly, the evolution of credit card debt, auto loans and student loans was very similar in the District and in the nation. Notice that this is true, although the evolution for each variable was very different: Credit card debt decreased after the financial crisis and has not recovered; auto loans declined very sharply after the crisis but recovered very quickly and, at the end of the period, were above previous levels; and, finally, student loans increased continually since 2004.
Thus, the difference in the evolution of total debt must be a consequence of mortgages and home equity loans. In particular, in the period 2004-2015, mortgages accounted for almost 90 percent of the total difference in the behavior of the nation and the District, while the other four types were much less significant: credit card, 2.52 percent; auto, 0.13 percent; student loan, 1.55 percent; and home equity, 9.14 percent.3
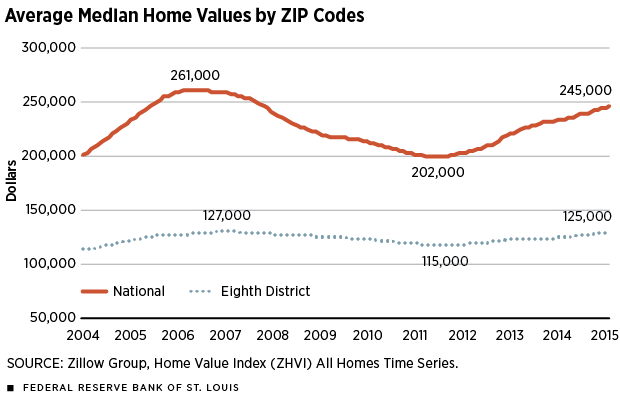
Now, why is the behavior of mortgages and home equity debt different in the District than in the nation? The gap could be explained by the differences in the level and evolution of house prices. Using the average median home values by ZIP code,4 we constructed the house prices for the nation and the District. (See Figure 2.) Prices on houses in the District are about half of the national average (exactly 55 percent on average during 2004-2015), and the District prices fluctuated much less than the national prices did. The national home values increased by 29 percent in 2004-2006, decreased by 23 percent in 2007-2011 and then recovered to almost their precrisis level. In contrast, in the District, home values increased by only 13 percent in 2004-2006, decreased by 9.4 percent in 2007-2011 and later rose by 9.7 percent.
Thus, the difference in the level of prices, which were lower in the District than in the nation, seems to account for the differences in the level of household debt in the District and the nation. This is due to the fact that households usually borrow (using both mortgages and home equity loans) up to a share of their houses’ value. The difference in the fluctuations in house prices, which were less volatile in the District than in the nation, could account for the difference in the evolution of household debt between the District and the nation. This may be the case because as prices decline (1) the value of home purchases is smaller and, consequently, the size of those mortgages is smaller, and (2) home equity (the difference between the value of the house and the remaining mortgage obligations) declines sharply, implying a reduction in the availability of home equity to borrow against with home equity loans and refinancing for home equity extraction. Thus, as the decline in house prices was larger in the nation than in the District, the deleveraging was larger in the nation than in the District.
Of course, this evidence is suggestive, and more research is needed to understand, for instance, why the timing of fluctuations in house prices seems to lead the fluctuations in mortgage debt and home equity loans.
Endnotes
- Auto debt is defined as the sum of auto finance debt and auto bank debt, both of which are reported in the original Equifax data set. [back to text]
- Home equity debt is defined as the sum of home equity installment debt and home equity revolving debt. [back to text]
- The shares of the five types of debt do not add up to 100 because there is a remaining “other” type of debt not discussed in this analysis, including consumer finance, retail and other debt reported in the Equifax data set, which accounts for –2.76 percent of the difference in total debt between the nation and the District. Notice that it can be negative because it is the share of a difference. The difference between the nation and the District for total debt is positive (more debt in the nation), but for “other” type of debt is negative (more debt in our District); so, the ratio of the two differences, which represents the share accounted by “other” type of debt, is negative. [back to text]
- The Zillow Home Value Index (ZHVI) All Homes Time Series data are available at www.zillow.com/research/data. [back to text]
Views expressed in Regional Economist are not necessarily those of the St. Louis Fed or Federal Reserve System.
For the latest insights from our economists and other St. Louis Fed experts, visit On the Economy and subscribe.
Email Us


