


Lifetime Benefits of an Education Have Never Been So High
Education in the United States has experienced three major transformations. The first occurred in primary education. Already by the late 19th century, no less than 80 percent of Americans between the ages of 5 and 13 were enrolled in grades K-8. The second was the so-called "high school" movement. Between 1910 and 1940, the percentage of Americans between the ages of 14 and 17 who were enrolled in high school rose from below 20 percent to close to 70 percent. Finally, there was higher education. This last movement gained momentum in the 1950s. The percentage of Americans between the ages of 18 and 24 who were enrolled in higher-education institutions rose from less than 20 percent in the 1950s to more than 50 percent nowadays.1
To discover the reasons behind this trend in educational attainment, economists rely on the comparisons between the costs and benefits of purchasing an education.2 In this article, I present a simple measure of the financial benefits of an education and do not discuss its cost. The measure that I present can be called a "lifetime education premium." This means two things: First, it is an attempt to measure the difference, i.e., the premium, between the earnings of people with different educational attainment. Second, it is about lifetime earnings, not just earnings at a particular age.
This latter point is key. To see why, consider a simple, and intentionally extreme, example. Suppose that some workers have a high school education and that their labor earnings are $60,000 per year during this year and the next. Others have a college degree, and their earnings are $100,000 this year and $120,000 in the next year. What is the college premium? This year, it is 66 percent (100/60–1=0.66), i.e., a college-educated worker receives labor earnings 66 percent higher than that of a high school-educated worker. Next year, however, the college premium is 100 percent (120/60–1=1), i.e., a college-educated worker receives double the earnings of a high school-educated worker.
So, the college premium changes throughout the lives of workers. Why? In this example, as in the data, the "culprit" is the fact that earnings of college- and high school-educated workers do not grow at the same rate: They grow faster for college-educated workers.
Building Estimates of Lifetime Income
Consider a white man who was 30 years old in 1940 and who did not have a high school education.3 Data from the U.S. Census Bureau can be used to compute that, on average, such person's labor earnings for the year, if he was employed and working, were $14,982 (in 2010 dollars). Consider now a white man who was 40 years old in 1950, still without a high school education. His earnings were $26,140. The 30-year-old of 1940 is the 40-year-old in 1950. Thus, by this procedure, we are constructing the sequence of earnings received by a particular cohort of individuals. We can identify them by the year of their 30th birthday.4 In this case, we are studying the 1940 cohort. We can keep using census data until we have collected the labor earnings of the 1940 cohort at ages 30, 40, 50 and 60. Then, we can do the same for the 1950, 1960, 1970 and the 1980 cohorts. The table shows the cohort structure. It is clear that the 1980 cohort is the last one for which we can construct earnings at age 60 using census data.
The Age of Cohorts
| Cohort/Year | 1940 | 1950 | 1960 | 1970 | 1980 | 1990 | 2000 | 2010 | |||||||||
|---|---|---|---|---|---|---|---|---|---|---|---|---|---|---|---|---|---|
| 1940 Cohort | 30 | 40 | 50 | 60 | |||||||||||||
| 1950 Cohort | 30 | 40 | 50 | 60 | |||||||||||||
| 1960 Cohort | 30 | 40 | 50 | 60 | |||||||||||||
| 1970 Cohort | 30 | 40 | 50 | 60 | |||||||||||||
| 1980 Cohort | 30 | 40 | 50 | 60 |
Using the earnings collected for each cohort and each year, it is possible to estimate the present value of future earnings for each cohort and for three education groups: no high school, high school and college.5 A present value calculation acknowledges that a current dollar is not quite the same thing as a future dollar, i.e., one that is available only in the future. Adding them would be the same as adding apples and oranges.6 The present value of future labor earnings of a worker can also be interpreted as the value of his or her human capital.
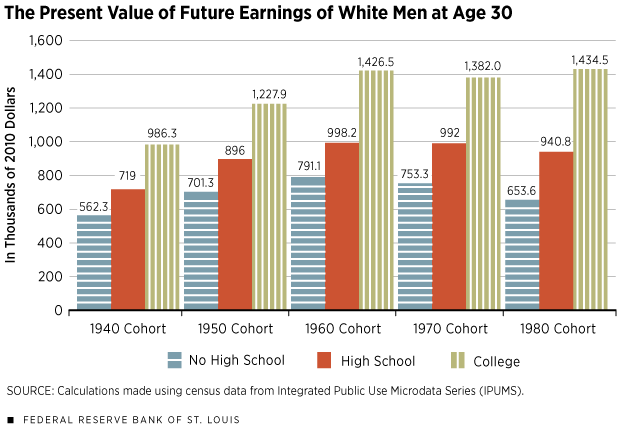
Figure 1 reports the results of these present value calculations for white men. I used an interest rate of 4 percent for all cohorts.7 This is a simplification since interest rates are not constant but, instead, vary from year to year. One must keep in mind, therefore, that the numbers presented here are approximations.
That said, take the 1940 cohort, for example: The present value of future labor earnings at age 30 for a white man without a high school education in 1940 was $562,300 (2010 dollars). For a high school-educated white man, the same calculation yields $719,000, and, for a college-educated white man, it is $986,300.
Figure 1 reveals interesting patterns, in particular that the present value of future earnings of the 1970 cohort is less than that of the previous cohort for all education groups. This is the result of the 1970 cohort's experiencing in the middle of its work life the severe recession of the mid-1970s and early 1980s, associated with the oil price shock. Even though the present value of future earnings of college-educated workers was on the rise again for the 1980 cohort, it was not the case for the two other education groups.
The Education Premiums
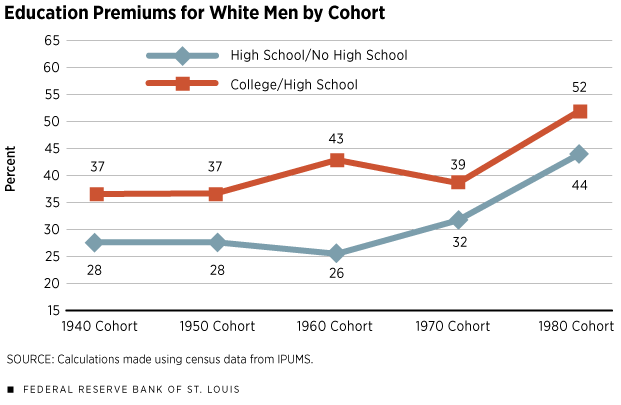
It is possible, using Figure 1, to compute two education premiums. Let us call the first one the "high school premium" and define it as the ratio between the lifetime income of a high school-educated worker and that of a worker not having completed high school. For the 1940 cohort of white men, this ratio is 719.0/562.3–1=0.28. Therefore, the high school premium is 28 percent, meaning, on average, that high school-educated white men of the 1940 cohort received 28 percent more lifetime earnings than did those without a high school education. The second premium is the college premium. Here, it is 986.3/719.0–1=0.37: College-educated white men of the 1940 cohort earned 37 percent more than high school-educated white men over the course of their work lives. Repeating the same observation for each cohort yields the results in Figure 2.
The overall pattern in Figure 2 is that of increasing premiums to education in the sense that the most recent cohorts are those for which obtaining an education pays the most. This is true for both the college and the high school premiums. This pattern explains, in part, the secular increase in educational attainment in the United States.
The rise of the high school and the college premiums displayed in Figure 2 is also interesting because it has implication for inequality. In fact, each premium is a measure of inequality on its own: the inequality of lifetime earnings between workers with different levels of educational attainment.
Conclusion
Understanding education choices is important since education determines, to a large extent, a worker's earnings. But measuring the benefits of an education is not that easy. I presented a simple measure of the benefits of purchasing an education for a sequence of cohorts and showed that these benefits have been on the rise for the last cohort. In fact, the lifetime financial benefits of an education have never been so high.
Endnotes
- The source of these figures is the U.S. Department of Education. [back to text]
- I use the term "purchasing" on purpose. There is no such thing as a free education, even for one enrolled in a public institution. At the very least, the time spent in school cannot be used to work for a living. In this sense, education is "purchased," and its price comprises the foregone earnings that it entails. [back to text]
- I considered only white employed men because the education and earnings of women and/or nonwhite people may involve issues of discrimination that are beyond the scope of this economic analysis. [back to text]
- It is customary to identify a cohort by the year of its birth, but it is not necessary to do so. For the purpose of the discussion here, it is more convenient to adopt the convention that what we call the "1940 cohort" is made of people who reached their 30th birthday in 1940. [back to text]
- I refer to a person as a "no high school" worker if his or her highest educational attainment is grade 11. I use "high school" to refer to workers who completed high school and up to three years of college, and, finally, I use "college" for those who completed at least four years of college. [back to text]
- Computing the present value of a future dollar involves choosing an interest rate. When the annual rate of interest is 4 percent, for example, the value today (the present value) of $104 in one year is $100. This is because having $100 today is the same as having $104 in one year: The dollars can be invested for one year at the rate of 4 percent. [back to text]
- The one-year Treasury rate fluctuated around 4 percent between the 1950s and the 1990s. [back to text]
References
Goldin, Claudia; and Katz, Lawrence. The Race between Education and Technology. Cambridge, Mass.: The Belknap Press of Harvard University Press, 2008.
Guvenen, Fatih; and Kuruscu, Burhanettin. "A Quantitative Analysis of the Evolution of the U.S. Wage Distribution: 1970-2000," in Daron Acemoglu, Kenneth Rogoff and Michael Woodford, eds., NBER Macroeconomics Annual. Chicago: The University of Chicago Press, 2009, pp. 227-76.
Heckman, James J.; Lochner, Lance; and Taber, Christopher. "Explaining Rising Wage Inequality: Explorations with a Dynamic General Equilibrium Model of Labor Earnings with Heterogeneous Agents." Review of Economic Dynamics, 1998, Vol. 1, No. 1, pp. 1-58.
Restuccia, Diego; and Vandenbroucke, Guillaume. "The Evolution of Education: A Macroeconomic Analysis." International Economic Review, 2013, Vol. 54, No. 3, pp. 915-36.

Views expressed in Regional Economist are not necessarily those of the St. Louis Fed or Federal Reserve System.
For the latest insights from our economists and other St. Louis Fed experts, visit On the Economy and subscribe.
Email Us