


Three Faces of Low Inflation: U.S., Japan and the Euro Area
For most central banks, maintaining inflation close to an explicit or implicit inflation target is a matter for the medium and long term. Therefore, it is not unusual to observe periods of inflation above target, followed by periods of inflation below target.
In the past year, perhaps temporarily, several economies have experienced inflation below 2 percent (a common inflation target), whether inflation is measured by the consumer price index (CPI) year-over-year growth rate (as used by the U.S. federal government, Japan and the euro area, as well as by several smaller advanced economies) or the personal consumption expenditures (PCE) chain-type price index growth rate (used in the United States by the Federal Reserve). However, inflation has been trending quite differently in various economies—up in Japan, down in Europe and relatively stable in the United States (but a bit below the Fed's 2 percent target). In this article, we decompose and analyze CPI inflation rates as recorded for their main components in April 2014. We used the CPI measure to improve comparability across countries, although several important differences across measures remain.
First, consider the United States, where inflation has decreased in the past two years. The year-over-year inflation rate measured by the headline CPI (which includes food and energy costs) was 2.29 percent in April 2012, dropped to 0.92 percent in October 2013 and then rose to 1.96 percent in April 2014; the corresponding figures for PCE were 1.98, 0.8 and 1.62 percent. Similarly, in the euro area, the year-over-year inflation rate measured by the Harmonized Index of Consumer Prices (HICP) was 2.6 percent in April 2012 and dropped to 0.7 percent in April 2014.1 In contrast, Japan is experiencing inflation growth. While Japan's average inflation rate in 2012 was negative, it reached 3.41 percent in April 2014—the highest rate since the 1990s.
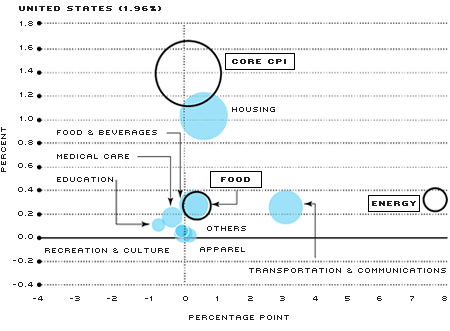
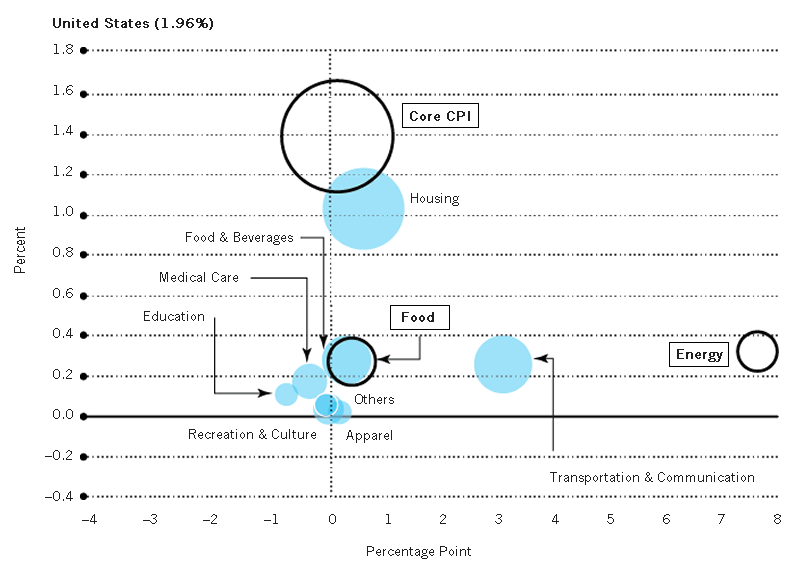
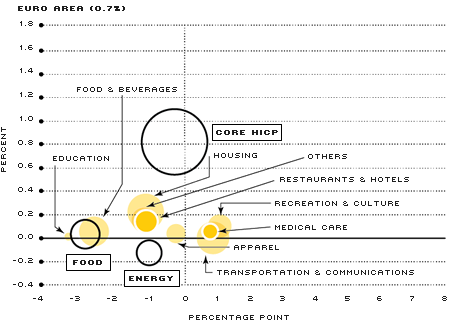
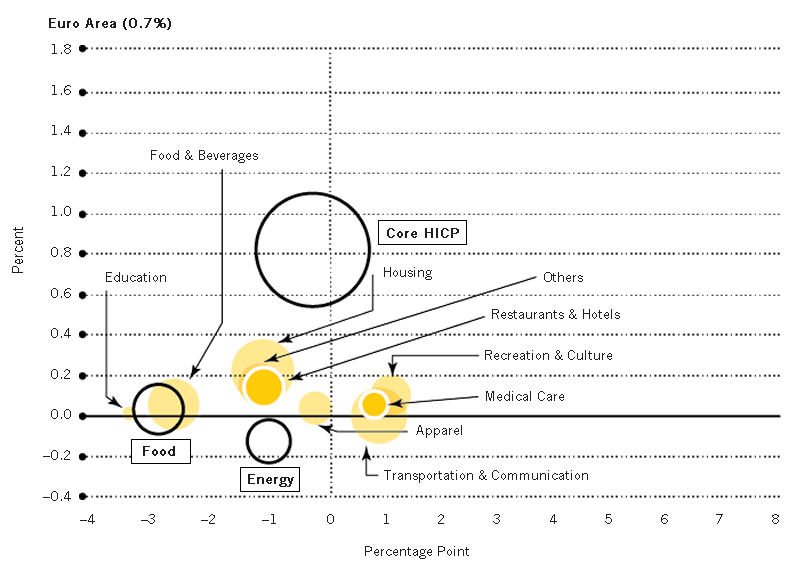
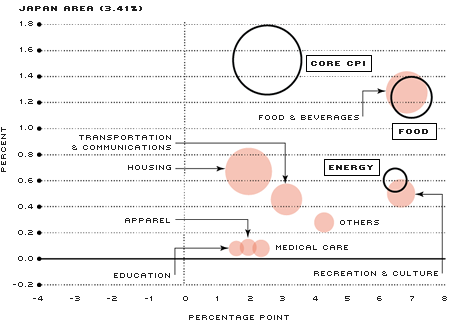
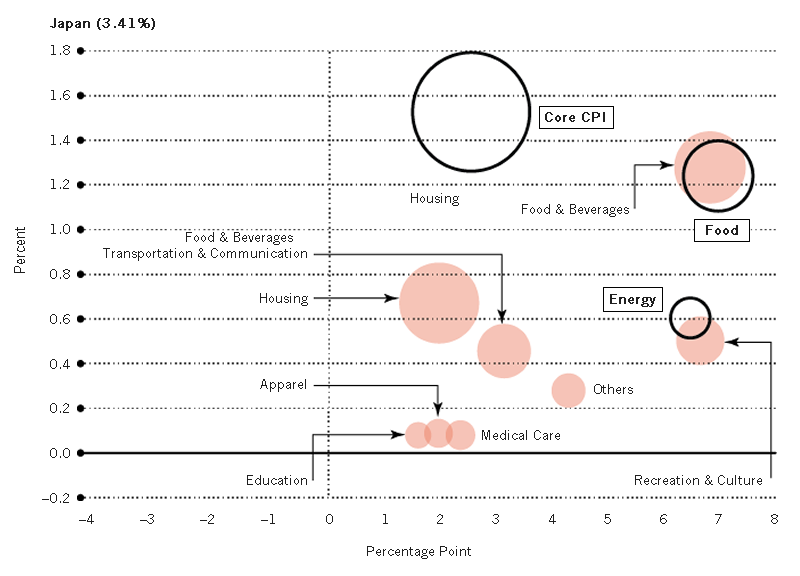
Contributions to Changes in Headline CPI Inflation (April 2013–April 2014)
NOTE: In these pictures, headline inflation is broken down according to two classifications of goods and services. The empty bubbles represent the breakdown in core, food and energy CPI/HICP inflation. The full bubbles represent a finer breakdown of the same index. In addition, to help comparability across countries, we regrouped some categories as follows: In the euro area, housing includes housing, water, electricity, gas and other fuel, furnishings, household equipment and routine household maintenance. In Japan, housing includes housing, furniture and household utensils.
SOURCES: Bureau of Labor Statistics, Eurostat, Statistics Japan and authors' calculation.
The figure shows the contributions of inflation components to headline inflation rates in the United States, the euro area and Japan in April 2014. The size of each bubble in the figure indicates the weight or relative importance of each component to the price indexes. For example, in the goods and services basket of the United States, food and beverages account for about 15 percent of the items, while housing accounts for about 41 percent. The center of a circle represents the respective (x,y) point of a certain category. The y-axis represents the inflation contributions of each component to total CPI/HICP inflation rates. (For example, in the United States, the inflation component for housing contributed more than half of the total 1.96 percent CPI inflation rate in April 2014.) The x-axis represents the percentage-point change of inflation rates from the previous year. (For example, for the dot representing food and beverages, the value on the x-axis is the year-over-year inflation rate only for these goods in April 2014 minus the year-over-year inflation rate for them in April 2013; if the inflation of food and beverages is falling between April 2013 and April 2014, then the dot will be in one of the left quadrants).
The U.S. CPI inflation rate fell below 2 percent in 2013 and early 2014. As shown in the figure, each component's inflation rate did not change much from 2013 to 2014, except for the energy and the transportation and communication components. According to the finer breakdown of CPI represented by blue bubbles, the inflation rate of the housing component increased by 0.58 percentage points, while the transportation and communication component increased by 2.98 percentage points. The rest of the components are clustered close to the vertical line separating the quadrants. Due mostly to those two components, inflation rates increased from 1.10 percent in April 2013 to 1.96 percent in April 2014. In the euro area, however, the majority of the yellow bubbles move downward and toward the left-hand side, indicating that the HICP inflation rate is trending down in April 2014 relative to April 2013. Japan shows a completely different picture, with most bubbles in the top-right quadrant. If we plotted the same graph moving everything back 12 months, most bubbles on Japan's figure would be in the bottom-left quadrant instead. Because most of the bubbles are in the right quadrants in the graph, there is a very visible shift associated with "Abenomics" (the set of new policies of Japanese Prime Minister Shinzo Abe), namely that prices are growing across categories of goods and services.
What to Make of These Breakdowns?
The first message is that while these three large economies have recently experienced inflation below 2 percent, the underlying trends appear quite different, and the low inflation rates in the three areas may have different explanations. The euro area is facing the biggest danger of creeping disinflation, while the United States and Japan are experiencing either stable or mildly increasing prices across a wide spectrum of goods and services.
Second, several studies have shown that there is a growing global component to domestic inflation deriving from food and energy prices (noncore items). However, food and energy prices are contributing differently to domestic inflation in the three areas. Imagine there was a large global shock (due to, say, military tension) that caused a large increase in oil prices. Then, in all areas we would likely observe the dot corresponding to energy in the upper-right quadrant because energy inflation would be growing and its impact on total inflation would be increasing. What we observe in the three areas, however, is that energy and food prices are not behaving in the same way in the three areas. Energy prices are growing in the United States and Japan, but decreasing in the euro area. (See energy in the figure.) Also, food prices are rising rapidly in Japan, are stable in the United States, but are decreasing in the euro area. (See food in the figure.) These different directions suggest that the current inflation behavior in the United States, the euro area and Japan may be responding more to domestic conditions than to global conditions.2
Why does the behavior of inflation matter for citizens? While slow price growth improves purchasing power of consumers, it also aggravates the real cost of repaying outstanding public and private debt, which is normally fixed in nominal terms and not indexed to inflation. Unfortunately, the large debt levels reached after the global financial crisis have not been worked out yet. On the producers' side, because nominal wages tend to move down only with difficulty, low inflation may increase the real wages and costs for producers, which may affect the recovery in progress.
Finally, there are important lessons learned from historical deflationary experiences, including the recent monetary history of Japan. While inflation expectations in the United States—and even in the euro area—are currently anchored at or close to 2 percent, if people begin anticipating declining rather than rising prices, the reversal of these expectations can prove very difficult to achieve. Obviously, inflation rates that are positive but closer to zero for a longer period carry bigger risks of altering inflation expectations.
While the recent low inflation rates may end up being just a temporary phenomenon in some advanced economies, it remains important to monitor and to understand their evolution, in particular their connection to inflation expectations.
Endnotes
- The HICP is a weighted average of price indexes in euro area countries; unlike the U.S. CPI, it takes into consideration both urban and rural consumers and excludes rental-equivalent costs of owner-occupied housing. [back to text]
- For a more formal analysis of global factors in domestic inflation, see Macklem. [back to text]
References
Macklem, Tiff. "Flexible Inflation Targeting and 'Good' and 'Bad' Disinflation." Remarks presented at John Molson School of Business, Concordia University, Montreal, Feb. 7, 2014, p. 8. See www.bankofcanada.ca/wp-content/uploads/2014/02/remarks-070214.pdf#chart6.
Views expressed in Regional Economist are not necessarily those of the St. Louis Fed or Federal Reserve System.
For the latest insights from our economists and other St. Louis Fed experts, visit On the Economy and subscribe.
Email Us