District Overview: Urban Areas Host the Largest Manufacturing and Service Employers
Over the past few decades, manufacturing employment as a share of total employment has declined across the U.S., with most of the manufacturing jobs lost in metropolitan areas. At the same time, cities have become increasingly more service-oriented.[1] Despite this general trend, metropolitan areas—and, in particular, large metropolitan areas—still contain the great majority of manufacturing jobs.
Similar to those across the U.S., urban areas in the Eighth District host the largest employers in manufacturing; urban areas also host the largest service employers. While service industries naturally thrive near large concentrations of people, manufacturing industries also gain from locating in urban areas, where they are near suppliers and firms in similar or related industries, including firms in related financial, legal and educational services. Cities also provide manufacturing firms potential workers of varying skill levels. Understanding the existing location patterns of both manufacturing and service industries is important because firms' location choices are in response to not only geographic advantages but also to public policies aimed at promoting employment growth or at developing targeted industries in certain areas.[2]
This article describes the geographic distribution of the largest (by employment) manufacturing and service industries in the 339 counties in the Eighth District. The best data for analyzing the distribution of industries and establishments across counties come from the County Business Patterns (CBP) statistics of the U.S. Census Bureau. The data are the latest available—as of March 2011.[3]
The analysis reveals interesting patterns. First, we found that in the Eighth District, both the largest manufacturing and the largest service industries were related to the food industry. Other important manufacturing industries were related to the auto industry, while other important service industries were related to the health-care industry. We also found that manufacturing employment was concentrated in a small number of industries, whereas service employment was spread across a larger number of industries. In addition, the average manufacturing establishment employed about three times as many people as did the average service establishment. Finally, except for a handful of counties in smaller urban areas—such as Tupelo, Miss.; Jasper, Ind.; and Paducah, Ky.—the largest concentrations of manufacturing and service employment and establishments occurred in or around the largest metro areas of the District.
The Largest Manufacturing and Service Industries
The largest three-digit manufacturing industry in terms of employment was food manufacturing (NAICS 311), with 109,212 employees and 1,065 establishments.[4] Other top three-digit manufacturing industries included transportation equipment (NAICS 336), with 84,152 employees and 646 establishments; fabricated metal products (NAICS 332), with 73,381 employees and 2,434 establishments; machinery manufacturing (NAICS 333), with 64,065 employees and 1,117 establishments; and plastics and rubber products (NAICS 326), with 61,424 employees and 716 establishments.
Among the service industries, the largest three-digit industry in terms of employment was also food-related: Food services and drinking places (NAICS 722) employed 454,361 people in 24,248 establishments across the District.[5] Other top service industries included: hospitals (NAICS 622), with 302,804 employees and 454 establishments; administrative and support services (NAICS 561), with 294,588 employees and 13,533 establishments; ambulatory health care (NAICS 621), with 260,645 employees and 24,736 establishments; and professional, scientific and technical services (NAICS 541), with 223,153 employees and 27,291 establishments.
Across the Eighth District, manufacturing employment was less diversified when compared with service employment. The 10 largest three-digit manufacturing industries in the District employed almost 80 percent of the total District manufacturing employment and made up about 74 percent of all manufacturing establishments in the District. In contrast, the top 10 largest three-digit service industries in the District employed only about 56 percent of total District service employment and represented only about 46 percent of all service establishments in the District. Manufacturing industries also employed more people per establishment on average, compared with services. Considering only the top 10 manufacturing industries, District counties were home, on average, to 1,687 manufacturing jobs in 31 establishments, or about 55 people per establishment. In contrast, District counties, on average, were host to 6,828 people in about 374 establishments in the largest service industries, or about 18 people per establishment.
The Geographic Distribution of Employment
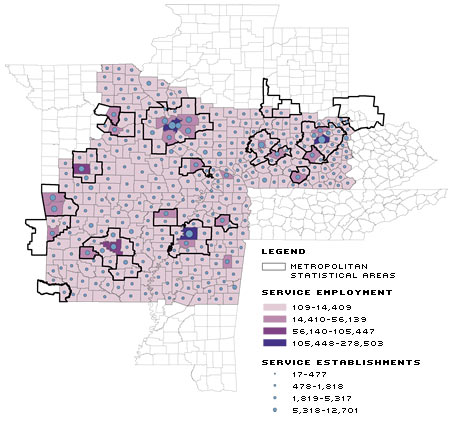
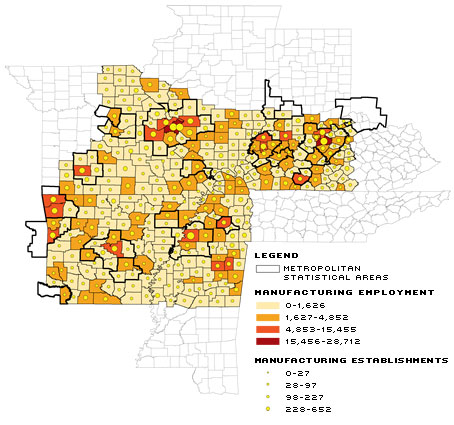
The maps present the distribution of employment and establishments across District counties for the 10 largest three-digit manufacturing and service industries in terms of employment. Perhaps not surprising, the highest concentrations of manufacturing and service employment occurred in or around large urban areas in the District, mostly in metropolitan areas but also in some micropolitan areas.[6]
The highest per-county levels of manufacturing employment, in excess of about 5,000 people, occurred in counties near Fayetteville, Fort Smith and Little Rock, Ark.; St. Louis and Springfield, Mo.; Tupelo, Miss.; Memphis and Jackson, Tenn.; Evansville and Jasper, Ind.; and Louisville and Bowling Green, Ky. These areas also contained the largest number of establishments, usually exceeding the District average of 31 establishments per county. Only St. Louis County, Mo., and Jefferson County, Ky., employed more than 20,000 people in the top 10 manufacturing industries.
The largest concentrations of service employment, exceeding 50,000 people, occurred near Fayetteville, Little Rock, Memphis, St. Louis, Springfield and Louisville. Similar to the manufacturing scenario, counties in these areas also contained the largest number of service establishments, often exceeding 2,500 establishments. In the District, only five counties employed more than 100,000 people in the top 10 service industries: St. Louis City and St. Louis County, Mo.; Pulaski County, Ark.; Jefferson County, Ky.; and Shelby County, Tenn. Among the largest nonmetropolitan service-employing counties were Adams County, Williamson County and Jackson County in Illinois; St. Francois County in Missouri; Lee County in Mississippi; and McCracken County in Kentucky, with all exceeding 10,000 employees in the top 10 service industries.

SOURCES: CBP, NAICS and geographic data from the U.S. Census Bureau

SOURCES: CBP, NAICS and geographic data from the U.S. Census Bureau
Endnotes
- See Friedhoff et al. [back to text]
- See Helper et al. [back to text]
- Although establishment data are always provided, county-level industry employment data are often suppressed to prevent identity disclosure. In the case of data suppression, employment data were imputed using establishment counts by size class. For additional information on the use of the County Business Patterns data set and a previous analysis using these data, see Hernández-Murillo and Marifian. [back to text]
- According to the North American Industry Classification System (NAICS), industries are classified with increasing degree of detail using classifications with two to six digits. For example, manufacturing (NAICS 31) is the broadest category, and following with finer level of detail, we have food manufacturing (NAICS 311), bakeries and tortilla manufacturing (NAICS 3118), bread and bakery product manufacturing (NAICS 31181), and finally, frozen cakes, pies and other pastries manufacturing (NAICS 311813). The 2011 County Business Patterns use 2007 NAICS codes. (See www.census.gov/eos/www/naics/.) Additional information on NAICS codes can be found at https://www.census.gov/cgi-bin/sssd/naics/naicsrch?chart=2007. [back to text]
- We define the service sector as the sum of industries with NAICS codes greater than or equal to 420 and less than 920. [back to text]
- A metro area contains a core urban area of 50,000 or more people, while a micro area contains an urban core of at least 10,000 but fewer than 50,000 people. For more information, see https://www.census.gov/programs-surveys/metro-micro.html. [back to text]
References
Friedhoff, Alec; Wial, Howard; and Wolman, Harold. "The Consequences of Metropolitan Manufacturing Decline: Testing Conventional Wisdom." 2010. Washington: Brookings Institution.
Helper, Susan; Krueger, Timothy; and Wial, Howard. "Locating American Manufacturing: Trends in the Geography of Production." 2012. Washington: Brookings Institution.
Hernández-Murillo, Rubén; and Marifian, Elise A. "Manufacturing and Construction Decline in the Ranks of Top 10 Employers." Federal Reserve Bank of St. Louis The Regional Economist, October 2012, Vol. 20, No. 4, pp. 14-16. See www.stlouisfed.org/publications/regional-economist/october-2012/manufacturing-and-construction-decline-in-the-ranks-of-top-10-employers.
U.S. Census Bureau. County Business Patterns: 2011. U.S. Department of Commerce, April 2013. See https://www.census.gov/programs-surveys/cbp/data.html.
Views expressed in Regional Economist are not necessarily those of the St. Louis Fed or Federal Reserve System.
For the latest insights from our economists and other St. Louis Fed experts, visit On the Economy and subscribe.
Email Us

