


Household Financial Stability: Who Suffered the Most from the Crisis?
Household wealth declined almost $17 trillion in inflation-adjusted terms, or 26 percent, from its peak in mid-2007 to the trough in early 2009.1 Only about two-fifths of that loss had been recovered by early 2012. Looking at individual asset categories between June 30, 2007, and March 31, 2009, the inflation-adjusted value of households' real-estate holdings declined 26 percent ($5.4 trillion), while stock-market equity holdings declined in value by 51.5 percent ($10.8 trillion) after adjusting for inflation.
Not surprisingly, wealth losses were distributed unevenly across the population. In dollar terms, older, wealthier households lost the most simply because their asset holdings were large to begin with and were more concentrated in equity investments, which declined sharply in value.
In percentage terms, however, the largest wealth losses typically were suffered by younger families, which tend to be less wealthy. Younger and middle-aged African-American and Hispanic families were especially hard-hit. Families headed up by individuals without a college degree also suffered larger average percentage wealth declines than did families headed by a college graduate. Although the younger, minority and less-educated families typically did not hold large positions in the stock market, many did hold a large amount of real estate relative to their incomes and total assets, mostly in the form of a primary residence. Many of these families also had relatively little owners' equity in their homes. This meant that declining house prices significantly reduced or even completely wiped out their owners' equity stakes, which had comprised a large part of their net worth before the crash. These groups also generally felt the brunt of job and income losses during the recession.
The Survey of Consumer Finances
The Federal Reserve tracks household balance-sheet conditions with its triennial
Survey of Consumer Finances (SCF).2 Virtually identical versions of the survey have been conducted every three years, beginning in 1989, with the two most recent surveys carried out in 2007 and 2010—just before and after the financial crisis and recession.3
To facilitate detailed economic analysis of household finances, the SCF collects information about each household's members, including the head of the household. The SCF allows classification of families along a number of demographic dimensions, including race and ethnicity, age and maximum educational attainment; the survey also gathers a number of economic, financial and social variables for each family, including family income, detailed balance-sheet data, job type and occupation, housing status (homeowner or renter), marital status, family structure, region of residence, and whether the family resides in an urban or rural community.
The SCF is one of the best sources of publicly available detailed information at a point in time on many aspects of household finances, including asset holdings, debts owed and each family's net worth, which is the difference between the total value of all assets and all liabilities. Net worth, or wealth, is the simplest comprehensive summary measure of a balance sheet's strength. This article focuses on changes in net worth between 2007 and 2010.
A First Look at Household Balance Sheets
Many discussions of financial and economic conditions at the household level sort individuals or families into categories based on their current incomes, wealth, homeownership status or another indicator that may change from one year to the next or may be chosen by that family. A number of interpretive problems arise in any such discussion; so, we rely in this article exclusively on demographic dimensions of population diversity that are not subject to change or choice to form groups for analysis. These dimensions are race or ethnicity, age and college-degree status. (See Sidebar 1.)
We define subgroups as follows:
- Race and/or ethnicity:
– Historically disadvantaged minorities, in which the interviewee is African-American or Hispanic of any race (henceforth, "HDM");
– Whites and other minorities, in which the interviewee is white non-Hispanic, is of Asian descent or belongs to another minority group not included elsewhere (henceforth, "WOM"); - Age:
– Family head is under 40 years of age (henceforth, "young");
– Family head is at least 40 but less than 55 years old (henceforth, "middle-aged"); or
– Family head is 55 years of age or older (henceforth, "old"); - College-degree attainment:
– Family head has received either a two-year or a four-year college degree (henceforth, "college grad");
– Family head has not received either a two-year or a four-year college degree (henceforth, "non-college grad").
In addition to the analytical advantages outlined in Sidebar 1, using these three dimensions of demographic diversity to study household financial outcomes reveals striking differences among various subgroups of the population. Because we can rule out the possibility of reverse causation (see Sidebar 1), a researcher or policymaker can be more confident when searching for underlying causes of diverging household financial outcomes, as occurred when wealth declined during the financial crisis.
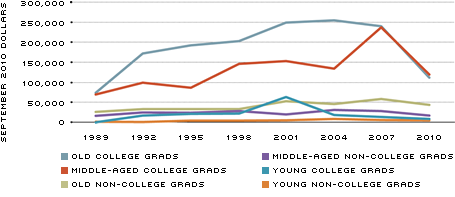
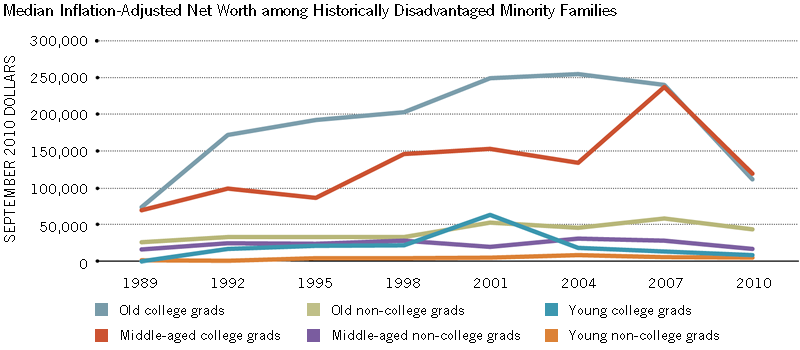
Median Inflation-Adjusted Net Worth among Historically Disadvantaged Minority Families
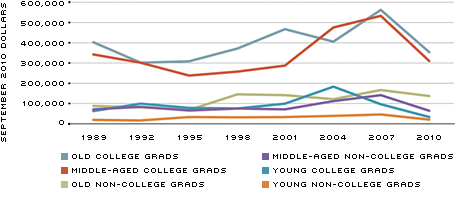
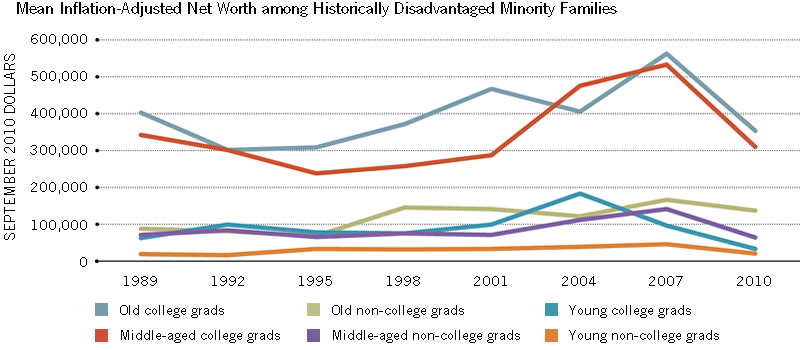
Mean Inflation-Adjusted Net Worth among Historically Disadvantaged Minority Families
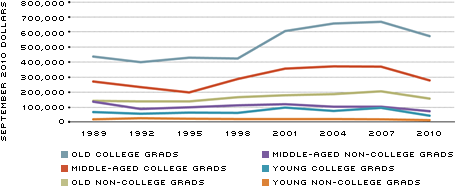
Median Inflation-Adjusted Net Worth among White or Other Minority Families (excluding African-Americans and Hispanics)
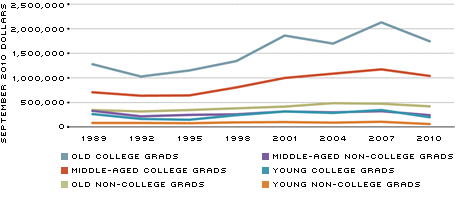
Mean Inflation-Adjusted Net Worth among White or Other Minority Families (excluding African-Americans and Hispanics)
SOURCE FOR ALL FIGURES: Survey of Consumer Finances, various years.
Breaking Down Wealth Declines
The decline between the median real (inflation-adjusted) net worth in 2007 and the median real net worth in 2010 was 39.1 percent among all families, according to the SCF; the decline in means was 15.0 percent.4 Splitting the sample into HDM and WOM families; young, middle-aged and old families; and families headed by college grads and non-college grads, respectively, we see evidence of differences along each dimension. (See Table 1.)
Comparing the percent changes in the medians and means within each subgroup, the SCF reveals that families that were young or middle-aged, less-educated, and members of historically disadvantaged minorities generally suffered larger wealth declines between 2007 and 2010 than did other families.5 In particular:
- The median (respectively, mean) real-net-worth decline among HDM families was 28.6 (37.2) percent, vs. a median (mean) real-net-worth decline among WOM families of 30.4 (11.0) percent;
- The median (mean) real-net-worth decline among young families was 37.6 (43.8) percent, among middle-aged families was 42.0 (19.9) percent and among old families was 18.6 (11.5) percent; and
- The median (mean) real-net-worth decline among non-college grad families was 38.9 (22.3) percent, vs. a median (mean) real-net-worth decline of 35.2 (15.5) percent among college-grad families.
Drilling Down Even Further
Figures 1 through 4 show the levels of median and mean inflation-adjusted net worth for each of 12 categories of families between 1989 and 2010, based on SCF data. Figure 1 displays the median net worth over time of historically disadvantaged minority families partitioned along two dimensions, age and college-degree status of the family head. Figure 2 shows the mean net worth over time for these groups. Figures 3 and 4 are analogous for white, Asian and other minority families.
Not surprisingly, the wealthiest among all age- and education-defined subgroups in most surveys was old college-grad families, whatever the race or ethnicity. Among WOM families, this was true in every survey, whether measured by median (Figure 3) or mean (Figure 4) net worth. For HDM families, the only exceptions were for the median in the 2010 survey (Figure 1) and for the mean in the 2004 survey (Figure 2). Families headed by a college graduate 55 years or older generally earned higher incomes over a longer period than families in other groups. In addition, higher cognitive abilities and more time to gain financial knowledge and experience likely aided wealth accumulation. Families with the lowest wealth among both race-defined groups in every survey were those headed by young non-college grads.
Figures 1 through 4 show that the second-wealthiest subgroup is families of any race headed by middle-aged college grads. The remaining three subgroups within each set of race-defined groups—middle-aged or old non-college grads and young college grads—have had similar wealth levels through the past several decades. At any given time, middle-aged and old non-college grad families have had more time to save and
gain financial experience than young families. But non-college grad families likely earned less at similar stages in their lives and may have had more difficulty mastering some financial challenges than college grads. Apparently, the various factors roughly offset each other at any given point in time for these subgroups.
Finally, careful comparison of Figures 1 through 4 reveals that, when holding age and college-degree attainment constant, the WOM median or mean value in each of the six age-education subgroups had higher net worth than the corresponding HDM median or mean family for each wave of the survey.6 In other words, whether we use the median or the mean inflation-adjusted value of net worth, every age-education subgroup that is a historically disadvantaged minority had lower wealth than its corresponding white, Asian and other minority counterpart in every survey, from 1989 to 2010.
In the 2010 survey, for example, HDM families' median net worth ranged from a low of 19.5 percent of the corresponding value of WOM families' net worth, in the old college-grad category, to a high of 42.9 percent of the WOM families' value, in the middle-aged college-grad category. Using mean values, HDM families' net worth ranged from 16.6 percent to a high of 36.1 percent of WOM families' net worth, holding constant the age and education attributes of those families.
Which Families Were Hit the Hardest?
Figures 1 through 4 reveal that all 24 of the subgroup measures (12 median measures and 12 mean measures) identified here showed declines in wealth between 2007 and 2010. The percentage declines in median inflation-adjusted net worth ranged from 14.2 percent, among old WOM college-grad families, to 54.1 percent, among young WOM college-grad families. Mean declines ranged from 11.3 percent, among old WOM non-college grads, to 65.8 percent, among young HDM college-grad families.
Tables 2 and 3 report median and mean percent changes, respectively, in real net worth between 2007 and 2010 for each of the 12 age- and education-defined subgroups we have identified, first for historically disadvantaged minorities and then for whites, Asians and other minorities.
Tables 2 and 3 show that, by either measure, the hardest-hit subgroups generally were young or middle-aged families. For example, 10 of the 24 subgroup measures
of inflation-adjusted wealth declined by 40 percent or more (considering Tables 2 and 3 together); nine of these 10 represented young or middle-aged family groups. Using the same metric (40 percent or larger decline in net worth), seven of the 10 subgroup measures corresponded to historically disadvantaged minorities. Combining the dimensions of age and race, six of the 10 subgroup measures that declined 40 percent or more were young or middle-aged historically disadvantaged minority groups.
At the other end of the scale, just six of the 24 subgroup measures of wealth declined less than 20 percent. Four of the six corresponded to middle-aged or old white, Asian or other minority families, while three of the six were white, Asian or other minority families aged 55 or older. Indeed, the wealthiest subgroup of all by a wide margin on any measure—old, college-educated white, Asian or other minority families—suffered comparatively small losses. The median net-worth decline in this group was 14.2 percent, the lowest among all 12 subgroups (six HDM and six WOM). The mean net-worth decline of this group was 18.1 percent, which was the fourth-lowest among the 12 subgroups.
We conclude that the financially most vulnerable groups—young and middle-aged, non-college-educated families belonging to a historically disadvantaged minority—
typically suffered the biggest wealth declines during the financial crisis and recession. While other subgroups also experienced large declines—such as young white, Asian or other minority families with or without college degrees—the survey evidence suggests that the most severe wealth losses were borne by historically disadvantaged minority families.
Conclusion
Median, or typical, wealth losses during the 2007-10 period generally were largest in percentage terms, and likely most painful, for some of the most vulnerable segments of the population—namely, families that were young or middle-aged, non-college-educated, and African-American or Hispanic. Based on our ongoing analysis of the Federal Reserve's Survey of Consumer Finances, we hypothesize that three important sources of unusually large percentage declines in wealth among young, middle-aged and HDM families were:
- large portfolio concentrations in housing before the crash—that is, housing represented a relatively large share of total assets;
- relatively large reported percentage declines in the value of real-estate assets, perhaps related to characteristics of neighborhoods inhabited by young, middle-aged, HDM and less-educated households; and
- higher "leverage," or mortgage-debt financing rather than equity financing, before house prices began to fall. Higher leverage meant that any decline in the value of a house was multiplied into a proportionately larger decline in the family's net worth.
What does it mean to conclude that young and middle-aged, less-educated HDM families suffered the greatest wealth declines during the financial crisis, perhaps because they were more likely to have shifted toward more highly leveraged, less-diversified balance sheets? Our use of demographic dimensions of diversity allows us to conclude that:
- Being young or middle-aged matters. This may be due to having children in the household and, therefore, facing constraints on how many hours can be worked and what unavoidable expenses are incurred; having relatively little financial knowledge or experience; or having had insufficient time to accumulate much wealth.
- Being a non-college grad matters. This may be due to the lack of certain cognitive abilities or specific learned skills that are important in financial decision-making.
- Being a member of a historically disadvantaged minority matters. This may be due to the fact that many minority households have faced discrimination—or the legacy of discrimination—in education, employment, housing or credit markets.
Endnotes
- See Federal Reserve Flow of Funds Accounts. [back to text]
- See Bucks et al. and Bricker et al. (2011 and 2012). [back to text]
- In a special interim follow-up survey in 2009, the Fed reinterviewed almost 90 percent of the 2007 survey participants in order to see how the financial crisis and recession were affecting Americans of all backgrounds. Due to the unique structure and limitations of that survey, we do not include results from it here. For more information, see Bricker et al. (2011). [back to text]
- All values are expressed in terms of September 2010 purchasing power, as measured by the Consumer Price Index for All Urban Consumers, Research Series, or CPI-U-RS. The median value is the one in an ordered group that is larger than half of all observations and smaller than the other half. The mean value is the arithmetic average of all observations. [back to text]
- See Bricker et al. (2012) and Taylor et al. [back to text]
- Using a different data source, Taylor et al. reach similar conclusions. [back to text]
- See Raskin. [back to text]
References
Bricker, Jesse; Bucks, Brian; Kennickell, Arthur; Mach, Traci; and Moore, Kevin. "Surveying the Aftermath of the Storm: Changes in Family Finances from 2007 to 2009." Federal Reserve Board Finance and Economics Discussion Series Working Paper 2011-17, March 2011.
Bricker, Jesse; Kennickell, Arthur; Moore, Kevin; and Sabelhaus, John. "Changes in U.S. Family Finances from 2007 to 2010: Evidence from the Survey of Consumer Finances." Federal Reserve Bulletin, 2012, Vol. 98, pp. 1-80.
Bucks, Brian; Kennickell, Arthur; Mach, Traci; and Moore, Kevin. "Changes in U.S. Family Finances from 2004 to 2007: Evidence from the Survey of Consumer Finances." Federal Reserve Bulletin, 2009, Vol. 95, pp. A1-A55.
Federal Reserve Board, Flow of Funds Accounts. See www.federalreserve.gov/releases/z1/default.htm
Raskin, Sarah Bloom. "Economic and Financial Inclusion in 2011: What It Means for Americans and our Economic Recovery" at the New America Foundation Forum, Washington, D.C., June 29, 2011.
Taylor, Paul; Kochhar, Rakesh; Fry, Richard; Velasco, Gabriel; and Motel, Seth. "Wealth Gaps Rise to Record Highs between Whites, Blacks and Hispanics." Pew Research Center, Social and Demographic Trends, July 2011.


Views expressed in Regional Economist are not necessarily those of the St. Louis Fed or Federal Reserve System.
For the latest insights from our economists and other St. Louis Fed experts, visit On the Economy and subscribe.
Email Us