District Overview: Eighth District Has Fared Better than Nation in Some Labor Statistics
Recent economic data indicate that the U.S. labor markets may have finally begun a steady recovery. The unemployment rate for the country decreased from 9.1 percent in August 2011 to 8.1 percent in April 2012.
Household employment increased 1.5 percent and job vacancies increased 9.7 percent during the same period.1 Labor markets in the Eighth Federal Reserve District, served by the Federal Reserve Bank of St. Louis, experienced a similar recovery.2 The District's unemployment rate fell from 9.5 percent to 8.1 percent, while employment and job vacancies increased 1.5 percent and 8.7 percent, respectively.
Before the recent improvement in labor markets, the unemployment rate remained high after the Great Recession. Popular explanations include the extension of unemployment benefits, the effect of discouraged workers re-entering the work force and the increase in mismatch between job vacancies and unemployed workers. The extension of unemployment benefits might have kept unemployed workers from taking unattractive jobs, keeping the unemployment rate high. Discouraged workers are those who stop searching for jobs; such workers might choose to re-enter the labor force after the recession is over, dramatically increasing the number of job seekers and preventing the unemployment rate from decreasing. The unemployment rate could remain high in this case even if employment increases. Mismatch refers to a poor match between the characteristics (such as skills and location) of vacant jobs and the characteristics of unemployed workers. The worse the mismatch, the longer it might take for a job seeker to find an ideal job, again keeping the unemployment rate high. Many people have suspected that job mismatch is on the rise because the unemployment rate remained high even though the number of job openings increased significantly.3
Below, we delve into three important economic indicators for labor markets: the unemployment rate, household employment and job vacancies. The recovery in labor markets in the Eighth District is compared with that of the nation.
Unemployment and Employment
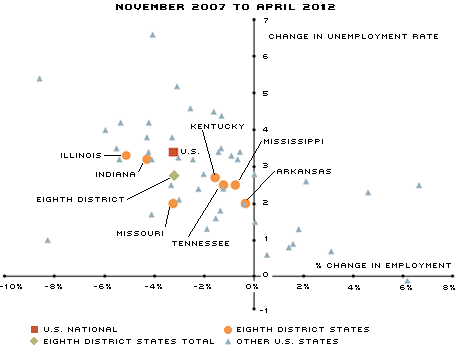
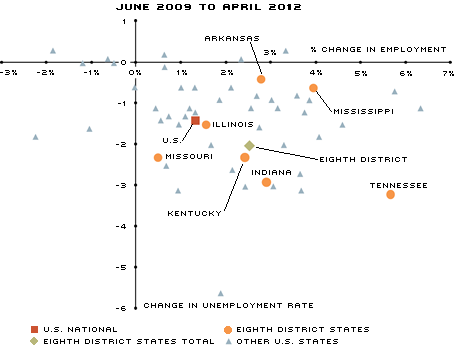
The accompanying figure compares changes in unemployment and household employment in multiple geographical areas, represented by different shapes. The change in unemployment is given in percentage points because it is the difference between two unemployment rates (which already are percentages). The change in employment is given in percent because it is the rate of change between two numbers of employed people.
Changes in the Eighth District states can be compared easily with changes in the other states in the nation. The left panel shows the change from November 2007, the month before the recession started, to April 2012, while the right panel shows the change from the end of the recession (June 2009) to April 2012. A drop in the unemployment rate between two periods would show up as a point below the horizontal axis; an increase in the rate would show up as a point above the same axis. Similarly, a drop in employment would place a dot to the left of the vertical axis; an increase in employment would show up as a point to the right of the same axis. Hence, a recovery in labor markets would show up as a point in the bottom-right (or fourth) quadrant.
As seen in the left panel of the figure, the unemployment rate and household employment had not returned, as of April 2012, to their prerecession levels. All the District states and most of the remaining states in the nation are located in the top-left (second) quadrant of the graph, indicating an increase in the unemployment rate and a decrease in employment from November 2007 to April 2012. Similar to that of the nation, the unemployment rate in the District was still 2.8 percentage points higher than its prerecession level, and employment was 3.2 percent lower. Among the District states, unemployment and employment in Illinois and Indiana were the ones furthest from their prerecession numbers.
Nevertheless, the labor markets improved relative to the end of the Great Recession. (as shown in the right panel). The District unemployment rate decreased 2.0 percentage points and household employment increased 2.5 percent between June 2009 and April 2012. For both statistics, the District performed better than the nation. All the District states also improved in both unemployment and employment. Tennessee outperformed all the District states, and most of the states in the nation, with a decrease of 3.2 percentage points in the unemployment rate and an increase of 5.7 percent in household employment. In contrast, Arkansas and Mississippi had only small declines in their unemployment rates (0.4 and 0.6 percentage points, respectively), and Missouri experienced a small increase in employment (0.5 percent).
Change in Unemployment Rate vs. Percent Change in Household Employment


SOURCE: The Bureau of Labor Statistics.
Job Vacancies
The improvement in the labor markets is more pronounced in terms of job vacancies. Vacancies surpassed their prerecession levels in both the nation and the District, increasing 11.7 and 26.2 percent, respectively, between November 2007 and April 2012. The average increase in vacancies in the District states was 43.7 percent. Illinois was the only state that experienced a decline (–4.7 percent). Both Arkansas and Mississippi experienced increases over 60 percent.
The table shows the changes in job vacancies (broken down into 10 occupations) since November 2007. The Eighth District fared better than the nation did in all categories of jobs. In the nation, vacancies in management, business and financial (MBF) occupations and in office and administrative support (OAS) occupations had not returned, as of April 2012, to their prerecession levels. In the District, MBF is the only occupation category that had not recovered, while the OAS occupations experienced the smallest increase relative to other occupations. Transportation and material moving jobs improved the most in both the nation and the District, with increases of 71.4 percent and 121.9 percent, respectively.
Endnotes
- Job vacancies are measured by the number of online job advertisements from the Conference Board's Help Wanted Online Data Series. [back to text]
- Data for the Eighth Federal Reserve District are aggregated for the entirety of the seven states in the District, even though parts of six of those states are not within the borders of the District. The seven states are Arkansas, Illinois, Indiana, Kentucky, Mississippi, Missouri and Tennessee. [back to text]
- See Canon and Chen, as well as Sahin et al., for more details on mismatch. [back to text]
References
Canon, E. Maria; and Chen, Mingyu. 2012. "A Review of Mismatch Measures Using Recent U.S. Data." Unpublished manuscript.
Sahin, Aysegül; Song, Joseph; Topa, Giorgio; and Violante, Giovanni L. "Measuring Mismatch in the U.S. Labor Market." Unpublished manuscript, revised October 2011. See www.newyorkfed.org/research/economists/sahin/USmismatch.pdf
Views expressed in Regional Economist are not necessarily those of the St. Louis Fed or Federal Reserve System.
For the latest insights from our economists and other St. Louis Fed experts, visit On the Economy and subscribe.
Email Us

