


Black/White Segregation in the Eighth District: A Look at the Dynamics
Based on a popular index, racial segregation decreased in the Eighth District's four major metropolitan areas between 1970 and 2000. This decline was not particular to the Eighth District; for example, a similar decline occurred in Chicago.
To help explain what happened, we created a simple way to decompose the decline in the index; by doing so, we found that the decline can be explained by opposing forces that are the same in all metro areas. The force that lowered the index of segregation was an increase in racial integration in historically highly black and highly white communities. The forces that partly offset this decrease were the suburbanization of the white population into new, highly white communities and, to a lesser extent, the increased segregation in communities that experienced "tipping" from highly white in 1970 to highly black in 2000.
The Basics of Our Study
Racial segregation exists in a city to the extent that people of different races do not share the same areas.1 Different types of areas can be analyzed, such as blocks, neighborhoods or counties. For this article, we documented the extent and evolution of black/white segregation across census tracts of the Eighth District between 1970 and 2000.2 Although 1970 is a good starting point (since it was the first decennial census year after the Civil Rights Act of 1964), we focused on the 1970-2000 period mainly because there exist adequate data for it.
The data we used come from the Neighborhood Change Database (NCDB).3 This dataset is built by transforming the original Census Bureau data in such a way that tract borders do not vary between 1970 and 2000.4 Using it, we could observe segregation changes within fixed plots of land. (Data from the 2010 census are not yet available in the NCDB format.) We used the Index of Dissimilarity (IOD), a popular measure of segregation among sociologists and economists, because it has a straightforward interpretation.
The Index of Dissimilarity
The IOD varies from zero to 100 percent. An IOD of 90 implies that at least 90 percent of one of the two groups (in this case, either black or white) would need to move to a different neighborhood to make all neighborhoods end up with the same racial mix.
Consider a dessert party in which two buckets of vanilla ice cream and one bucket of chocolate ice cream are to be served. To serve all guests with the same vanilla-chocolate mix, each guest would need to be served two scoops of vanilla with each scoop of chocolate. If each bucket contains 100 scoops, all one ends up doing is serving 1 percent of the total amount of vanilla ice cream together with each 1 percent of the total chocolate ice cream. The IOD captures how far the party is from the homogeneous distribution by comparing the percentages of the total chocolate and vanilla ice cream served onto each plate. For example, a plate that contains 5.7 percent of the chocolate ice cream and 1.3 percent of the vanilla ice cream contributes (5.7% – 1.3%) to the IOD (i.e., 4.4 percentage points). Adding up the contributions from all plates with excess chocolate gives the total index. (The calculation is identical if we consider plates with excess vanilla instead.) When the percentages are equal on all plates, the index is zero. When no plate contains both flavors, the index is 100 percent—full segregation.
For a concrete example, consider St. Louis in 1970. In that year, the population of St. Louis was 2,071,043. Of those, 375,090 persons were black and 1,688,491 were white.5 St. Louis as a whole was 18.2 percent black.
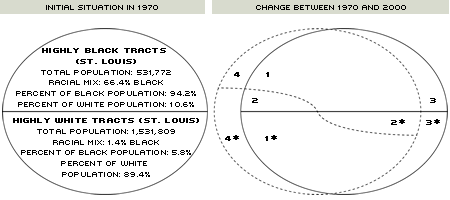
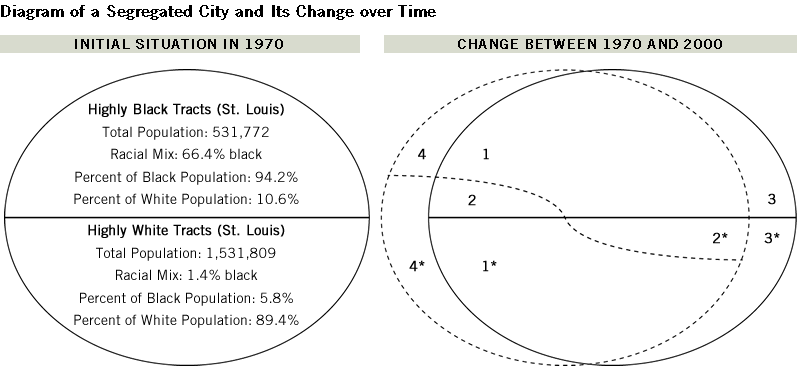
Diagram of a Segregated City and Its Change over Time
NOTE: We report some statistics for St. Louis in the "Initial Situation in 1970" panel, but a similar partition can be done for any MSA. We do not report statistics directly on the "Change between 1970 and 2000" panel. Statistics for each of this panel's numbered areas are reported in the table.
The left panel of the diagram summarizes segregation in St. Louis by joining all tracts that were more than 18.2 percent black into what we call the "highly black" (HB) area and by joining all tracts that were less than 18.2 percent black into what we call the "highly white" (HW) area. The diagram shows that 94.2 percent of the black persons in St. Louis lived in HB tracts while only 10.6 percent of the white persons lived in those tracts. (Recall that these two percentages would have needed to be equal for the neighborhood to have been exactly 18.2 percent black.) One hypothetical way for the HB area to become fully integrated would be to reduce its percentage of blacks in that area to 10.6 percent, which would be equal to the percentage of whites in that area. To achieve this reduction, the equivalent of 83.6 percent of all black people in St. Louis would have needed to move out of the HB area. If this amount of black people would have moved into the HW area, the percentage of all black persons living in the HW area would have risen from 5.8 percent in the diagram to 89.4 percent—exactly equaling the percentage of all white persons living in the HW area. Therefore, this movement would have sufficed to achieve perfect integration in HW and also in HB areas.
In summary, 83.6 percent of all black persons in St. Louis would have needed to change neighborhoods in 1970 in order to make all areas fully integrated. This percentage was the IOD for St. Louis in 1970. This exercise could be repeated with the white population moving out of HW areas, and the resulting IOD would be unchanged.
IOD's Change over Time
In 1970, the IOD in District metropolitan statistical areas (MSAs) was very high, ranging from 73.3 percent in Little Rock to 83.6 percent in St. Louis, while it was slightly above 90 percent in Chicago. The IOD fell for all MSAs in our table between 1970 and 2000. The largest declines happened in Louisville (20 percentage points) and Little Rock (15 percentage points), while Chicago, St. Louis and Memphis observed milder declines (approximately 12 percentage points).
To get some notion as to why the IOD fell in all of our MSAs, consider the right panel of the diagram. The diagram shows how cities change between two points in time—say 1970 and 2000. In 1970, the city is represented by solid lines, and area types 1, 2 and 3 are HB, while 1*, 2* and 3* are HW, just like in the left panel of the diagram. In 2000, the city is represented by dotted lines. Each area represents neighborhoods that experienced different kinds of changes between 1970 and 2000. We can name each kind of change using popular terminology:
White Resegregation: Tracts that stay HW, represented by area 1.
Black Resegregation: Tracts that stay HB, represented by area 1*.
Tipping Black to White: Tracts that switched from HB to HW, represented by area 2.
Tipping White to Black: Tracts that switched from HW to HB, represented by area 2*.
Depopulation: Tracts that became vacant, represented by areas 3 and 3*.
Suburbanization: Tracts that were empty in 1970 but became populated by 2000, represented by areas 4 and 4*.
For any city, each area described by the right panel of the diagram contributes to the change in the IOD over time. This contribution depends on the size of the area and on the change in segregation within the area. Therefore, we can decompose time changes of the IOD by calculating the portion that accrues to each area. The table presents this decomposition, and we describe its contents below.
Both White Resegregation and Black Resegregation had large negative effects on the IOD. This means that although many tracts stayed HB or HW between 1970 and 2000, these types of tracts became more mixed.
Tipping White to Black appreciably helped to increase the IOD in Chicago (5.3 percentage points) and Little Rock (2.8 percentage points). This implies that the tipping tracts became at least as segregated after becoming HB as they were when HW. Tipping Black to White did not have a large effect on the index in any MSA.
Depopulation of HB tracts reduced the IOD in Little Rock by 2.6 percentage points, while the effect in other MSAs was below one percentage point. This means that the tracts that were HB in 1970 and were empty or very sparsely populated by 2000 were highly segregated in 1970.6 In contrast, Depopulation of HW tracts did not appreciably change the IOD. Suburbanization into new HB tracts did not impact the index appreciably, except in Memphis, where it increased the index by 0.7 percentage points. In contrast, Suburbanization into HW tracts had a large positive effect on the index in all MSAs, with the largest effects in Little Rock and Memphis.
Endnotes
- The U.S. pattern of racial residential segregation has been studied by economists since the mid-20th century, following the seminal works of Gunnar Myrdal and, later, Thomas Schelling. Sociologists have also made important contributions to the measurement and theory of racial segregation. For an overview of segregation measurement, see www.census.gov/hhes/www/housing/resseg/app_b.html [back to text]
- Census tracts are small units of land delineated by the Census Bureau. These units subdivide a county and usually contain between 2,500 and 8,000 people. [back to text]
- Tract level data come from the Neighborhood Change Database (NCDB) by Geolytics Inc. The database contains tract-level population counts from the 1970, 1980, 1990 and 2000 U.S. decennial censuses. [back to text]
- The Census Bureau redefines tract boundaries for each decennial census. [back to text]
- In this population count, we only consider black and white population. We also consider tracts with population density of fewer than 100 people per square kilometer as empty and normalize their population to zero. [back to text]
- Note that an empty tract contains zero percent of each of the populations, so that it contributes 0 percent to the Index of Dissimilarity. The change in segregation in these areas is the new level of segregation (zero) minus the old level. [back to text]
References
Schelling, Thomas C. "Dynamic Models of Segregation." Journal of Mathematical Sociology, May 1971, Vol. 1, No. 2, pp. 143-86.
Myrdal, Gunnar. "An American Dilemma: the Negro Problem and Modern Democracy." New York: Harper & Brothers, 1944.
Massey, Douglas; and Denton, Nancy. "The Dimensions of Racial Residential Segregation," Social Forces, December 1988, Vol. 67, No. 2, pp. 281-315.
Views expressed in Regional Economist are not necessarily those of the St. Louis Fed or Federal Reserve System.
For the latest insights from our economists and other St. Louis Fed experts, visit On the Economy and subscribe.
Email Us