


A Closer Look at House Price Indexes
Central to economic events of recent times were the rapid increases in house prices after 1995 and the ensuing downturn in those prices around 2006-07. Naturally, the importance of accurate measurement of house price trends can hardly be overemphasized. Several prominent house price indexes have been developed for the United States. These include the National Association of Realtors (NAR) median index, the Census Bureau median index, the S&P/Case-Shiller national index, the CoreLogic index and the Federal Housing Finance Agency (FHFA) index.1 Each differs in methodology, in its emphasis on the various segments of the housing market or both. To the casual observer, the difference in price changes recorded on each of the indexes can be perplexing. Therefore, knowing how the indexes differ from one another can be instructive as to which index to follow.
Housing price indexes are calculated by tracking home prices in a given region over a period of time. Ideally, one would track the price of a random sample of houses. However, this method has operational problems because, at any particular point in time, not all houses are for sale; additionally, there may be variations in the type of houses sold. If one merely tracked the price of homes sold over time (e.g., as is found in median house price indexes, such as the NAR and the Census indexes), observed changes could be due to changes in the composition of homes sold as opposed to changes due to market conditions. Dealing with houses that differ in "hedonic" characteristics—such as the square footage, number of bedrooms and distance from city center—can be tricky.
To deal with these issues, economists have adopted a "repeat sales" methodology, which measures price changes of the same house between a previous and current sale.2 Examples of repeat sales indexes include the Case-Shiller, CoreLogic and FHFA indexes. This method allows economists to control for home characteristics—the previous sale price being considered an appropriate surrogate for the hedonic information. An obvious limitation is the omission of sales of new homes. Additionally, to maintain consistency, repeat sales indexes often drop houses that have undergone major improvements or deterioration. Consequently, this method's calculations require a large number of repeat sales, which can be problematic for nonmetropolitan areas and also during downturns. Finally, it has been shown that repeat sales with larger time gaps in between transactions have greater variance, leading some indexes to adjust their weight downward.
Two median price indexes are noteworthy: the NAR index and the Census Bureau median index. The former dates to 1968. The data come from surveys of sales of existing single-family homes from NAR affiliates. The national median is calculated by value-weighting the median within each of the four census regions in the country by the number of single-family homes in each region.
The Census Bureau median index differs from the NAR index mainly in that the former covers new homes as opposed to existing structures. Consequently, the Census median index is typically higher than the NAR index (see Figure 1) since, historically, new homes have been higher-priced than existing homes. In terms of both indexes, prices have clearly fallen since their peaks in 2006-07. However, the gap between the two has widened recently, largely due to the steeper decline in the NAR index. One possible reason: Existing homes have seen an increase in foreclosures and short sales, placing downward pressure on the NAR index. Distressed sales are less of a concern in the market for new homes, and the Census median index has not fallen as sharply.
Median Price Indexes
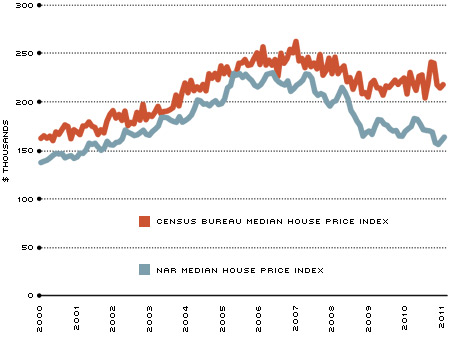
SOURCES: National Association of Realtors and the Census Bureau/Haver Analytics
Indexes of repeat sales are more commonly cited than median indexes. The FHFA index is published quarterly by the FHFA and goes back to 1975. The FHFA also publishes several other indexes, including regional, state, metropolitan, purchase only, average and median price indexes on a monthly and quarterly basis.
Standard & Poor's publishes the Case-Shiller proprietary family of indexes, which includes quarterly national, monthly 10- and 20-composite metropolitan area, and individual metropolitan series.
The final index is the monthly CoreLogic index, a proprietary index published by CoreLogic and dating to 1976. Additionally, CoreLogic publishes a variety of indexes based on property locations, price tiers, property types, loan types and distress levels.
Among the three major repeat sales indexes, the FHFA index is significantly different from the other two. FHFA collects data from conforming mortgages only (i.e., those securitized by Fannie Mae or Freddie Mac).3 The Case-Shiller and CoreLogic indexes, however, include all available arm's-length transactions on single-family homes, including sales financed with nonconforming mortgages—such as jumbo, Alt-A and subprime. As a result, these indexes include sales of higher-priced homes (those financed with jumbo mortgages) and transactions with more-volatile sales prices (those financed by Alt-A or subprime mortgages). Moreover, unlike the FHFA index, the Case-Shiller and CoreLogic indexes value-weight transactions so that higher-valued homes have greater effect on the index.4 A final distinction is that the FHFA index includes refinances, whereas the Case-Shiller and CoreLogic indexes do not.5
While the Case-Shiller and CoreLogic indexes are similar, they are different on two counts. In addition to value-weighting, the Case-Shiller series employs an interval-weighting procedure that places greater weight on repeat sales with shorter intervals. Such a weighting scheme is not adopted by CoreLogic. Also, CoreLogic has larger coverage because it includes mortgage data in place of public records in states with nondisclosure laws. This helps it obtain a broader coverage by including some states with nondisclosure laws that are omitted in the Case-Shiller index.
Figure 2 shows various repeat sales indexes.6 Notably, the FHFA index is flatter than the other two indexes. First, the CoreLogic and Case-Shiller indexes place more weight on higher-valued homes; so, if higher-priced homes have larger appreciations and, subsequently, larger depreciations, then these indexes will likely see larger swings. Second, the FHFA index is less volatile because it does not include nonconforming loans. Combined, these factors can help explain why the FHFA index is flatter than the other two series.
Repeat Sales Indexes
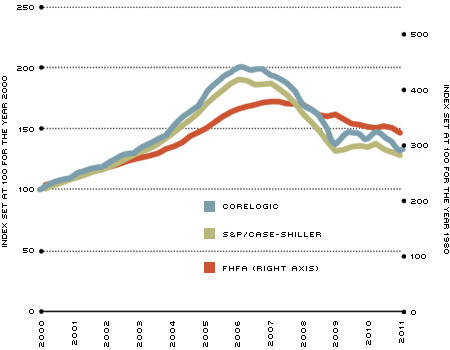
SOURCES: CoreLogic, Standard & Poor's and Federal Housing Financing Agency/Haver Analytics
Not surprisingly, the CoreLogic and Case-Shiller indexes tend to move together because of their similar computation and included loan types. However, the CoreLogic index tends to be slightly higher than the Case-Shiller national index. This is possibly due to the smaller weight on lengthier intervals between sales in the Case-Shiller index. Stated differently, the statistical procedure used in the Case-Shiller index likely mitigates the influence of sales pairs with extreme price changes.
It is not always a fact that home price indexes move in tandem. It is not difficult to record instances where changes in home prices differ in both direction and magnitude. This is true, for example, of the FHFA and Case-Shiller indexes for the second quarter of 2010. The differences in methodology and composition determine the behavior of each index at different points in time. Knowledge of individual index calculation aids in understanding the observed disparities among the indexes.
Endnotes
- The FHFA house price index was formerly titled the OFHEO index. [back to text]
- This methodology was developed by Bailey, Muth and Nourse and was later modified by Karl Case and Robert Shiller (1987, 1989). [back to text]
- See http://en.wikipedia.org/wiki/Non-conforming_mortgage [back to text]
- See Aubuchon and Wheelock. [back to text]
- The FHFA also publishes a purchase-only index that excludes refinances. [back to text]
- Note that the Case-Shiller index is quarterly, whereas the CoreLogic is monthly. [back to text]
References
Aubuchon, Craig P.; and Wheelock, David C. "How Much Have U.S. House Prices Fallen?" Federal Reserve Bank of St. Louis National Economic Trends, August 2008.
Bailey Martin J.; Muth, Richard F.; and Nourse, Hugh O. "A Regression Method for Real Estate Price Index Construction." Journal of the American Statistical Association, December 1963, Vol. 58, No. 304, pp. 933-42.
Case, Karl E.; and Shiller, Robert J. "Prices of Single-Family Homes Since 1970: New Indexes for Four Cities." New England Economic Review, September/October 1987, pp. 45-56.
Case, Karl E.; and Shiller, Robert J. "The Efficiency of the Market for Single-Family Homes." American Economic Review, March 1989, Vol. 79, No. 1, pp. 125-37.

Views expressed in Regional Economist are not necessarily those of the St. Louis Fed or Federal Reserve System.
For the latest insights from our economists and other St. Louis Fed experts, visit On the Economy and subscribe.
Email Us