


District Overview: Should Real Estate Prices Be Falling More in the Eighth District?
One of the most important economic events of the last decade is the real estate boom and bust. National house prices, as measured by the Federal Housing Finance Agency (FHFA), increased 70 percent since 2000 to a peak in the second quarter of 2007. Since then, national home prices have fallen roughly 15 percent.
House prices in the Eighth District also appreciated over the period, but the boom/bust process was less-pronounced. House prices in the Eighth District increased 40 percent to a peak in the first quarter of 2008 and have fallen roughly 5 percent since then. By partly avoiding the sharp decline in prices experienced in other areas, it appears that the District has fared better than the nation.1 Has it?
Prices that don't fall aren't always a good sign. The labor market is a useful example of this. One of the most controversial puzzles in macroeconomics is why wages (real and nominal) do not fall more during recessions in reaction to high unemployment. Under some conditions, falling wages would reduce unemployment and improve economic efficiency in downturns.2
Vacant real estate properties can be partly thought of as unemployed workers. These properties are resources ready to be put to some kind of use. As another step toward determining whether Eighth District real estate markets are faring better than the nation's, it is informative to look at the behavior of vacancies. How large is the fraction of vacant home and business structures in the Eighth District? How does that fraction compare with the rest of the nation's? How has this fraction behaved over the real estate boom and bust? This District Overview uses several data sources that complement one another in order to answer these questions.
Vacancies from Survey Data
The first source of data consists of survey-based estimates of residential vacancies collected by the U.S. Census Bureau. Figure 1A displays average homeowner vacancy rates in normal times and in distressed times for the three largest metropolitan statistical areas (MSAs) in the Eighth District, the nation's total and two additional comparison MSAs.3 Clearly, vacancy rates have increased everywhere since the beginning of the crises. Figure 1A also demonstrates that in both normal and distressed times, residential vacancy rates in Louisville and St. Louis are roughly equal or slightly lower than in the nation as a whole. In contrast, vacancy rates in Memphis exceed the national level during both periods. Interestingly, Memphis is also atypical in terms of prices. Memphis has experienced deeper price declines than the rest of the District since the onset of the crisis.
Residential Vacancy Rates
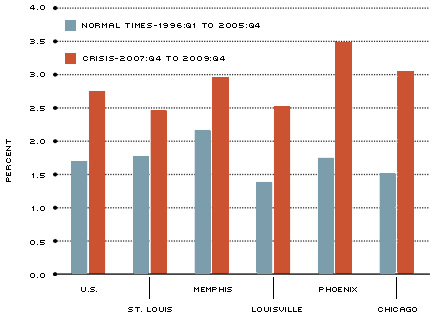
NOTE: The Census Bureau provides data for the 75 largest MSAs in the country.
Data are not available for Little Rock.
SOURCE: Census Bureau/Haver Analytics
[back to text]
In general, the milder decline in Eighth District residential prices compared with the U.S. was not accompanied by a larger increase in rates of vacancy. This suggests that, compared with the rest of the country and using increases in vacancies as a rough indicator, prices in the District are not "too high."
The second source of data consists of survey-based estimates of industrial vacancies as compiled by real estate firm CB Richard Ellis. Figure 1B paints a different picture for industrial vacancy rates than for residential vacancy rates. Although industrial vacancy rates are higher in all geographic areas in the recent period of distress, St. Louis experienced substantially larger increases in industrial vacancies than did the country or Chicago.
The next source of data allows us to track the behavior of each quarter since the start of the recession. Is the situation moving back to normal?
Industrial Vacancy Rates
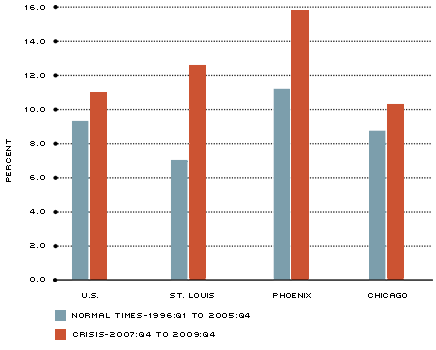
NOTE: Eighth District data only available for St. Louis.
SOURCE: CB Richard Ellis/Haver Analytics
[back to text]
Vacancies from HUD-USPS Data
The Department of Housing and Urban Development (HUD) assembles data on vacancies provided by the U.S. Postal Service (USPS). These data have the immense advantage of including all residential and business addresses in the nation. The main disadvantage is that data are only available since the start of the recession, when the real estate crisis was already well-advanced. The USPS classifies each address as "occupied," "vacant" or "no status."
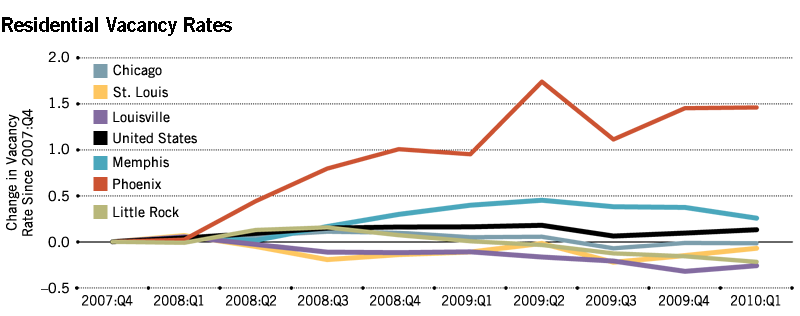
Residential Vacancy Rates
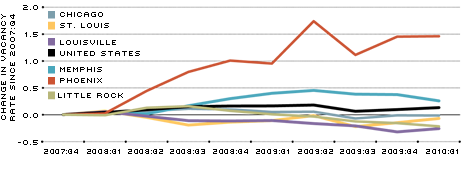
SOURCE: U.S. Department of Housing and Urban Development (HUD)
Click to enlarge
In Figure 2A, residential vacancies show no strong movements since the start of the recession. This is true for the nation and for most of the MSAs analyzed with the exception of Phoenix and the District's own Memphis, where vacancies were higher by March 2010 than at the start of the recession. A promising sign is that the residential vacancy rate in Memphis has decreased slightly for several quarters.
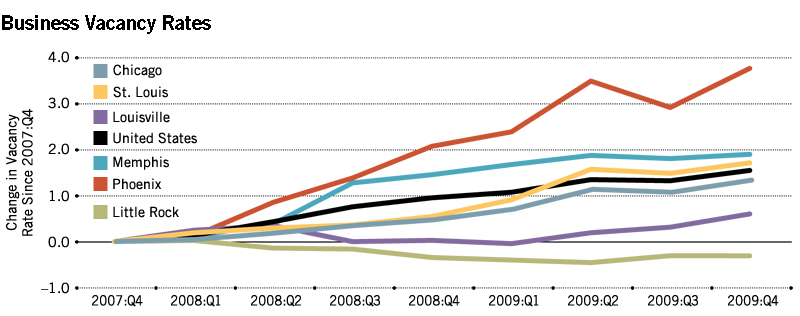
Business Vacancy Rates
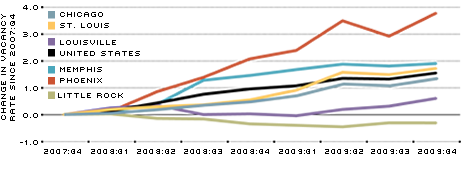
SOURCE: U.S. Department of Housing and Urban Development (HUD)
NOTE: The data are geographically coded from ZIP+4 to census tracts by HUD. The data are then aggregated to the MSA level by the authors. The vacancy rates in this figure ignore the "no status" category reported by the USPS. It is possible that this category contains vacant addresses; see http://www.huduser.org/portal/datasets/usps.html for details. Additional analysis that treats the "no status" category as vacant yields similar conclusions.
Click to enlarge
In contrast, Figure 2B shows that business vacancies are on the rise both in the nation and in most District MSAs, with the exception of Little Rock.
Conclusions
Vacancy rates are informative in interpreting the behavior of real estate prices in the Eighth District as "better" or "worse" than in the country as a whole. Although prices didn't fall as much in the Eighth District as in the country, vacancy rates did not rise as much either. This roughly supports the view that prices should not be falling more in the Eighth District.
However, residential vacancies show no clear sign of heading back to normal times in the District or in the country, while business vacancies are on the rise. Sluggish marketing of foreclosed properties, legal barriers to the sale of underwater properties by their owners, the unwillingness of households and businesses to enter neighborhoods with high foreclosure rates, and/or the overabundance of unfinished real estate projects are among the candidates for explaining the persistence of high vacancy rates.
Endnotes
- See Aubuchon and Bandyopadhyay. [back to text]
- See Bewley for a lucid discussion. [back to text]
- The Census Bureau provides vacancy data for the 75 largest MSAs in the country. Little Rock is not among them. [back to text]
References
Bewley, Truman F. Why Wages Don't Fall during a Recession. Cambridge, Mass.: Harvard University Press, 1999.
Aubuchon, Craig P.; and Bandyopadhyay, Subhayu. "Decline in House Prices Slows Down; District Still Faring Better than Nation." The Regional Economist, April 2010, pp. 18-20.
Views expressed in Regional Economist are not necessarily those of the St. Louis Fed or Federal Reserve System.
For the latest insights from our economists and other St. Louis Fed experts, visit On the Economy and subscribe.
Email Us