


Digging Into the Infrastructure Debate
The nation's public infrastructure is crumbling and in dire need of repair, according to conventional wisdom. This view seems to have become more strident after the Minneapolis bridge collapse in 2007. The American Recovery and Reinvestment Act of 2009 (ARRA) ostensibly addresses this concern by providing $111 billion for infrastructure and science projects. Of this amount, about a quarter ($27.5 billion) was set aside for spending on highway construction. Officials in the seven states that comprise parts or all of the Eighth Federal Reserve District have already proposed infrastructure projects totaling several billion dollars.
A well-functioning public infrastructure system is necessary to support rising living standards over time, but other factors are also crucial to improving these standards. Moreover, the evidence that the nation's public infrastructure has fallen into wide-spread disrepair does not appear to be overwhelming. Even if it turns out to be, ongoing and emerging structural changes in the economy may necessitate a more
careful assessment of future outlays for traditional infrastructure.
The State of Public Infrastructure
The nation's infrastructure can be thought of as its tangible capital stock (income-earning assets), whether owned by private companies or the government.1 This can include everything from the Toyota manufacturing plant in Indiana to the FedEx and UPS warehousing and distribution facilities in Memphis and Louisville, respectively.
However, to most people, infrastructure is the nation's streets, highways, bridges and other structures that are typically owned and operated by the government. More than 75 percent of the government's capital stock is owned by state and local governments.
Several recent reports on the health of the nation's infrastructure rate it to be in relatively poor shape. According to some organizations, such as the American Society of Civil Engineers (ASCE), this is a long-standing concern. Every few years, the society rates 15 categories of public infrastructure. In its 2009 Report Card for America's Infrastructure, the ASCE said that only three of 15 categories merited a C (mediocre), while the remaining 12 barely passed with a D (poor). This year's cumulative grade (D) is unchanged from the society's previous report in 2005, and it differs little from the reports issued in 2001 (D+) and in 1998 (D). The ASCE further says
that the United States needs to more than double planned infrastructure spending over the next five years, or by about $1.1 trillion, to put the nation's infrastructure in "good condition." About half of this infrastructure gap is due to deteriorating roads and bridges.
Citing the ASCE's findings, the National Governors Association (NGA) published
An Infrastructure Vision for the 21st Century this year.2 According to the NGA, "The nation's infrastructure system is no longer adequately meeting the nation's needs and faces several long-term challenges that affect our ability to maintain and enhance our competitiveness, quality of life and environmental sustainability."
Other studies sound similar alarms. For example, the Organisation for Economic Cooperation and Development (OECD) said in 2007 that advanced countries besides the United States face similar problems:
"A gap is opening up in OECD countries between the infrastructure investments required for the future, and the capacity of the public sector to meet those requirements from traditional sources." 3
Yet, the Congressional Budget Office estimated last year that spending on the U.S. transportation infrastructure was roughly $16 billion below the spending needed to maintain current levels of service.
Divergent studies about infrastructure gaps are not new. In a comprehensive study published in 1994, the late economist (and former Fed governor) Edward Gramlich noted that engineering assessments of infrastructure gaps that were originally
published in the early 1980s became progressively smaller over time "as they were done more carefully." Of course, it is certainly possible that engineering assessments have improved over time in response to these criticisms.
Increased traffic congestion is one of the costs associated with inadequate public spending on infrastructure. In a 2007 report, the Texas Transportation Institute at Texas A&M University estimated that the costs associated with travel delays and wasted fuel (congestion costs) in nearly 450 urban areas totaled $710 per person (in 2005 dollars), about 25 percent higher in inflation-adjusted terms from a decade earlier.4 Since a significant portion of these congestion costs reflects the fact that a scarce resource (roads) is made freely available to everyone early in the morning and late in the afternoon (rush hour traffic), economists generally argue that some form of congestion pricing—rather than new infrastructure outlays—would mitigate these costs.5
The Economics of Infrastructure Spending
Economics is the study of how society responds to incentives when deciding how to allocate scarce resources. Since this decision process necessarily involves trade-offs, economies that prosper over time tend to allocate their economic resources to the purchase of capital that produces the highest rate of return. In the private sphere, this generally occurs as businesses strive to maximize profits and returns to shareholders. In the public sphere, these questions are equally valid, but answering them often requires information that is not readily available. For example, how does a city determine the rate of return on a new police station, unless it can accurately
determine the value of future crimes that might be prevented?
Competing demands for public services besides infrastructure compound the problem confronting government authorities. For example, if a city has $X to spend on infrastructure improvements, will the rate of return on a highway overpass produce a higher rate of return than an improvement to a city's sewer or flood-control systems?
These questions are often difficult to answer, but are nonetheless important. Some might believe that the presence of trade-offs forces government officials to neglect bridges and other facilities. However, as the sidebar How Safe Are the Nation's Roads and Bridges?" shows, the rhetoric is sometimes not matched by the reality.
Most economists believe that capital formation is an important determinant of economic growth over time because more capital per worker usually leads to a higher level of output per worker (productivity). In the late 1980s and the early 1990s, many academic articles were written that discussed the effects of public infrastructure on the nation's productivity. In particular, some economists suggested that a reduction in public capital spending may have been an important contributor to the 1973 slowdown in U.S. labor productivity growth.6
Although other factors were likely more important in explaining the productivity slowdown, public infrastructure is nevertheless important because it facilitates the production of many private goods and services. For example, many trucking firms and package delivery services are heavy users of the nation's streets, highways and public airports. Accordingly, additions to the public capital stock can improve living standards, as well as provide other benefits not captured in the economic statistics, such as time saving or outdoor recreation.
Over time, additions or subtractions to the capital stock will depend on both macroeconomic factors (how well or poorly the economy is performing) and microeconomic factors (performance of the state or local economy or the ability of state and local authorities to raise money). Some of the key macroeconomic determinants of infrastructure spending include:7
1. Growth of per capita income and technical change:
The development of the internal combustion engine and commercial aviation has dramatically altered the scope and composition of the nation's infrastructure. For example, as the U.S. grew wealthier after World War II, the number of registered vehicles per person age 16 and older doubled between 1948 (0.4) and 1971 (0.81). One of the responses to this development was the interstate highway system.
2. Population change:
Having more people generally entails a larger demand for public schools, hospitals, fire stations and other basic infrastructure.
3. Other factors, such as the relative cost of public services:
Increases in commodity and energy prices have significantly increased construction costs since 2002. Higher construction costs generally mean fewer bridge or street projects.
The Government's Role in Infrastructure Spending
Economists have long argued that the provision of certain kinds of infrastructure is one of the major responsibilities of government. In fact, Adam Smith in The Wealth of Nations argued that providing public works is the "third and last duty" of the government.8 In a market economy, new goods and services naturally occur in response to perceived profit opportunities. For example, if a firm correctly perceives an unmet demand for a shopping center, it will reap considerable profits from its construction.
However, this is generally different for public goods like highways or bridges. First, public goods are usually very expensive to build and maintain, and the state or local government generally reaps no profit from its use by the citizenry. If a bridge is designed and built to generate revenue for the governing authority, it would have to impose a toll sufficiently high enough to cover its construction costs, maintenance and opportunity cost. However, if the toll is too high, drivers may use an alternative route, leaving revenue lower than expected. Regardless, the new bridge would probably still reduce traffic and congestion in other areas, which means that there would be benefits accruing to those who did not use the bridge.
Public goods that provide social benefits to those who do not directly use the bridge are called externalities. The presence of externalities means that a private firm would not be willing to finance such a large capital outlay unless it can earn a profit—in other words, capturing a part of the revenue generated by using the bridge (in our example). This is why most large-scale capital projects are funded by the taxpayer—even if some taxpayers who do not use the bridge benefit from its construction.
At the state and local (microeconomic) level, there are many additional factors that will influence an authority's decision to increase or rebuild its infrastructure. These include political considerations, engineering assessments and the performance of the local economy (which affects tax revenue). Other microeconomic determinants include:
1. Budget constraints:
Most state and local governments have some form of a balanced budget requirement, which limits their ability to fund expensive new projects out of general revenue. When revenue declines, as in recessions, public projects often get canceled or delayed.
2. Net benefits:
A project will be economically feasible if its benefits exceed its costs. Although estimating budgetary costs are straightforward, there may be nonbudgetary costs—for example, excessive reliance on debt may reduce a state's or municipality's credit rating, forcing it to pay a higher rate of interest. Estimating the dollar value of benefits can be extremely difficult.
3. Rate of return:
A project is also economically feasible if its real rate of return exceeds an estimated real interest rate that could be earned on revenue invested elsewhere (opportunity cost). According to Gramlich, estimates of the real rate of return on public infrastructure vary greatly—ranging from large and positive (maintaining current highway conditions) to negative (reinforcing structures to exceed minimum standards).
Trends in Infrastructure Spending
As the nation's policymakers debate the size and scope of future infrastructure investments, it is necessary to try to ascertain whether public investment has been lacking over the past several years. Table 1 provides an estimate of the real (inflation-adjusted) value of public capital (structures and equipment and software) divided by the resident U.S. population (per capita) from 1997 to 2007, including its growth rate over this 10-year period.9 From 1997 to 2007, real per capita structures (infrastructure) rose from about $19,800 to nearly $21,800, an increase of 0.95 percent per year. This increase was about half of the increase in real GDP per capita over this period (1.81 percent). If the demand for public structures per person grows in tandem with per capital real GDP growth, then U.S. infrastructure spending may have been shortchanged over this period. However, it is difficult to know definitively whether that has been the case because of recent changes in the composition of the capital stock reflecting other factors.
To see this, consider the following three categories from Table 1: industrial structures, health care structures and military structures. The decline in public health care structures is perhaps surprising, but may reflect the rapid growth of spending on health care services (Medicare and Medicaid) that has come at the expense of new facilities. For military structures, the demise of the Cold War and the wars in Iraq and Afghanistan may have necessitated increased spending on armaments rather than structures.
The two largest categories—education facilities and highways—present a study in contrasts. First, the per capita stock of highways, which is the largest category, increased from just under $5,000 per person to a little more than $5,300 per person, or roughly 0.7 percent per year. This increase, however, was less than half of the growth rate in real GDP per capita and suggests some evidence that a portion of the nation's roads and highways need repairing. But does it? Recall that highway construction costs have increased sharply since 2002, undoubtedly affecting outlays.
Moreover, as Figure 2 shows, two other factors may be at work. First, miles driven per person age 16 and older has been declining since 2004. Second, the use of public transportation has been increasing considerably since 1995.10 It is likely that both of these factors have been influenced by the increase in real energy prices from 2002 to 2008. Indeed, similar patterns were experienced during the oil shocks that occurred in the 1970s.
As seen in Table 1, the public transportation capital stock per person has grown rapidly since 1997. Although public transit data are available only through 2006, it is likely that the rise in gasoline prices in 2007 and 2008 increased public transit usage further. If these trends continue, then it would be natural to see smaller future increases in public spending on roads and bridges.
By contrast, the stock of real public education facilities per person increased much faster than real GDP per capita over this period. Early in the post-World War II period, the baby boom necessitated a boom in school construction. The school-age percentage of the population (ages 5 to 24) rose from a little more than 31 percent in 1945 to a post-World War II peak of about 38 percent in 1970. Since then, the school-age share fell to a post-WW II low of about 27.5 percent in 2007.
All else equal, this drop should slow the growth of school construction. Public education outlays, however, have increased. This increase may be due to increased outlays by state governments on college structures and may be related to the wage gap between those with a high school diploma and a college degree. With only about a third of the labor force holding a college degree, it may not be surprising to see increased expenditures on community colleges and four-year colleges.11
Going forward, private and public policymakers may need to think anew about how they use their scarce resources to build the nation's infrastructure of the future.12 To take just one example, an increasing share of commerce is conducted over the Internet, which conceivably reduces the need for more traditional infrastructure facilities, such as airports and roads, while increasing the need for other types of facilities and equipment. Second, if the price of energy resumes its increase in real terms, then growth in the demand for traditional, carbon-based fuels will naturally slow or decline, and new and different kinds of alternative fuels will likely increase in use. This change would entail shifting resources to a different kind of energy infrastructure.
Finally, the retirement of the baby boomers promises to put additional strains on government budgets at all levels, as well as on the private sector. An aging population naturally requires more health-care facilities, which will necessitate increasing public outlays, likely financed either with higher taxes or with revenue originally dedicated to other areas of the budget. The result: Those who support more spending on infrastructure will face more competition for scarce resources.
Table 1
Real Public Capital Stock Per Person
2000 Dollars
| PER CAPITA AMOUNTS | GROWTH | ||
|---|---|---|---|
| 1997 | 2007 | 1997-2007 | |
| Total |
$19,828
|
$21,787
|
0.95
|
| Equipment and Software |
$2,507
|
$2,740
|
0.89
|
| Structures |
17,317
|
19,066
|
0.97
|
| Residential |
814
|
833
|
0.23
|
| Industrial |
252
|
182
|
-3.18
|
| Office |
1,208
|
1,449
|
1.84
|
| Commercial |
87
|
92
|
0.51
|
| Health Care |
556
|
555
|
-0.01
|
| Education |
2,920
|
3,743
|
2.51
|
| Public Safety |
487
|
518
|
0.61
|
| Amusement |
448
|
531
|
1.72
|
| Public Transportation |
878
|
1,120
|
2.47
|
| Power |
564
|
587
|
0.41
|
| Highways |
4,985
|
5,330
|
0.67
|
| Military |
1,304
|
1,076
|
-1.90
|
| Conservation |
645
|
626
|
-0.29
|
| Other |
2,171
|
2,424
|
1.11
|
| Addenda | |||
| Growth rate of real GDP per capita |
1.81
|
||
NOTE: Total government capital stock. Figures may not sum to totals because of chain-weighting system.
SOURCE: Authors' calculations based on data published by the Bureau of Economic Analysis.
Figure 2
Transportation
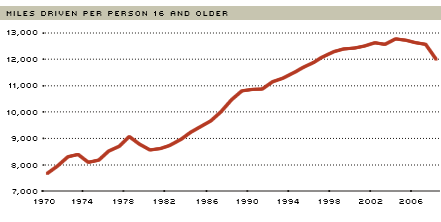
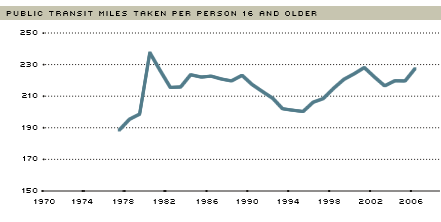
SOURCES: Bureau of Labor Statistics, Federal Highway Administration, and American Public Transportation Association.
Infrastructure Investment in the Eighth District
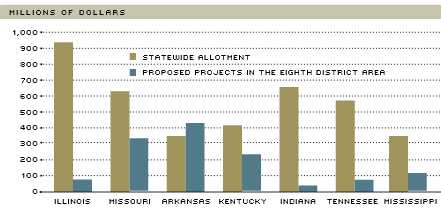
In 2009, the American Recovery and Reinvestment Act (ARRA) provided tens of billions of federal dollars to state and local government officials for "shovel ready" infrastructure projects. As seen in Figure 1, nearly $1.3 billion in infrastructure investment has been requested thus far by governors for state transportation projects that will take place in the Eighth District.13
Arkansas and Missouri have advanced the most comprehensive and expensive infrastructure projects. Nearly 60 percent, or $761 million, of the total proposed infrastructure work in the Eighth District stems from proposals issued by the Arkansas and Missouri state governments. However, since Arkansas' total ($436 million) surpasses the ARRA amount actually designated to infrastructure investment in Arkansas, other federal aid, as well as state and local funds, will make up the difference.
The Missouri Department of Transportation has requested about $325 million to fund 81 programs in the Eighth District. The majority of these projects call for refurbishing state routes and highways, and several direct significant investment toward the utilization of newer, more efficient modes of repairing roads.
In Illinois, state and local government officials have already identified projects that would use three-quarters of the $936 million designated to Illinois for infrastructure investment. Within the Eighth District, proposals for $81 million in state infrastructure projects have been made. As in Missouri, most of the ARRA proposals pertain to road and bridge repair.
Within Mississippi's portion of the Eighth District, state officials have requested funding for 33 state projects. Of the $103 million being sought, 72 percent is directed toward road maintenance and improvement, with the remainder directed mostly toward bridge repair and replacement. The road maintenance and improvement projects encompass approximately 265 miles of road repair and rehabilitation.
A significant portion of the infrastructure projects proposed by the Indiana Department of Transportation was originally budgeted for future years. ARRA has allowed Indiana to bring forward a number of these future projects, as well as a list of newly created projects, most of which are dedicated to road repair and preventive maintenance. In fact, of the $34 million in proposed infrastructure projects, nearly $21 million is dedicated to preventive roadway maintenance.
Currently, the departments of transportation in both Tennessee and Kentucky have designated 52 state projects to use infrastructure funding in the Eighth District. Tennessee has requested almost $70 million, primarily for the resurfacing of roads and the replacement of nine bridges, while Kentucky has advanced proposals for over $220 million to repair streets, widen highways and build new roads. The Kentucky Department of Transportation has also asked for $1 million for public transportation enhancements within the Eighth District.
Endnotes
- It is important to distinguish between capital stocks and capital flows. The latter is the annual or quarterly change in the capital stock, otherwise known as fixed investment, which is part of GDP. This article will focus on capital stocks. [back to text]
- See Springer and Dierkers. [back to text]
- See OECD.[back to text]
- See the Texas A&M report at http://mobility.tamu.edu. [back to text]
- See Congressional Budget Office or the 2008 Economic Report of the President.
[back to text] - For a flavor of the debate, see Gramlich or Tatom and the references cited therein. [back to text]
- See Musgrave and Musgrave. [back to text]
- The other two duties are defense and justice (enforcement of laws). See Book III. [back to text]
- Because of changes in the structural classification of the capital stock by the Census Bureau, measures of the capital stock in Table 1 before 1997 are not consistent with those from 1997 to the present. [back to text]
- See American Public Transportation Association. [back to text]
- See Kolesnikova and Shimek. [back to text]
- Also see the discussion in Council of Economic Advisers, Chapter 6. [back to text]
- Shovel-ready projects are required to use at least 50 percent of the requested money within 120 days. Dollar figures in this section refer to areas in the geographic boundary of the Eighth District. Figures exclude funds approved and designated by local governments. [back to text]
References
American Public Transportation Association. 2008 Public Transportation Fact Book, 59th Edition, June 2008. See http://www.apta.com/resources/statistics/Documents/FactBook/APTA_2008_Fact_Book.pdf.
American Society of Civil Engineers. 2009 Report Card for America's Infrastructure, March 25, 2009. See www.asce.org/reportcard.
Congressional Budget Office. Issues and Options in Infrastructure Investment. Congress of the United States, May 2008.
Council of Economic Advisers. 2008 Economic Report of the President. Government Printing Office, 2008.
Gramlich, Edward M. "Infrastructure Investment: A Review Essay." Journal of Economic Literature, Vol. 32, September 1994, pp. 1176-96.
Kolesnikova, Natalia; and Shimek, Luke. "Community Colleges: Not So Junior Anymore." Federal Reserve Bank of St. Louis The Regional Economist, Vol. 16, No. 4, October 2008, pp. 6-11.
Musgrave, Richard A.; and Musgrave, Peggy B. Public Finance in Theory and Practice. New York: McGraw-Hill, 1989.
Organisation for Economic Cooperation and Development. Infrastructure to 2030:
Vol. 2, Mapping Policy for Electricity, Water and Transport, 2007.
Smith, Adam. An Inquiry Into The Nature and Causes of The Wealth of Nations. Edwin
Canaan, ed. New York: Modern Library, 2000.
Springer, Darren; and Dierkers, Greg. An Infrastructure Vision for the 21st Century. National Governors Association, Washington, D.C., 2009.
Tatom, John A. "Should Government Spending on Capital Goods Be Raised?" Federal Reserve Bank of St. Louis Review, Vol. 73, No. 3, March/April 1991, pp. 3-15.

Views expressed in Regional Economist are not necessarily those of the St. Louis Fed or Federal Reserve System.
For the latest insights from our economists and other St. Louis Fed experts, visit On the Economy and subscribe.
Email Us