


The Changing Face of the Eighth District
Now that the 2000 census is complete, an updated face can be put on the population in the Eighth Federal Reserve District.
Looking at population breakdowns is important because a region's population growth determines, to a large extent, its labor force growth, which ultimately translates into economic growth. This article represents the first step of a more comprehensive analysis of the demographic and economic attributes of the Eighth District. As more data become available, other articles will expand and broaden on this analysis. This article will take the first cut of the census data and describe changes in the overall population and racial composition of the District to understand how its face has changed since 1990.
The District1
According to the census, the District's population on April 1, 2000, was 13,455,055 people, up 7.5 percent from 1990. By comparison, the nation's population grew by 13.2 percent over the same period. In 2000, the District's population was 4.8 percent of the nation's; in 1990, it was 5 percent.
The District's total population has a somewhat greater percentage of whites and African-Americans than does the population for the nation as a whole. In the District, 80.3 percent of the population is white (only one race marked), while in the nation the share is 75.1 percent. The District's African-American population (only one race marked) accounts for 16.5 percent of the District's total. Nationwide, African-Americans make up 12.3 percent of the total. In other words, almost 97 percent of District residents are either white or African-American, a figure that is about 10 percentage points higher than the national number.2
The District's States
This section examines data on the individual states in the District—but only those portions of the states that lie within the District itself. Many of the major population centers in these states—Chicago, Indianapolis, Kansas City and Nashville, for example—fall outside the boundaries of the District. Including these metro areas in the analysis could easily skew the descriptions.
In 2000, as in 1990, Missouri was the District state with the largest population—about 3.57 million people. This figure was up only 2.4 percent from 1990, though. Arkansas, Kentucky and Tennessee followed Missouri in the 2000 population ranking in the District. Not surprisingly, these four states are also the ones that contain the largest District cities—St. Louis, Little Rock, Louisville and Memphis. States in the southern part of the District—Arkansas, Mississippi and Tennessee—exhibited the strongest population growth rates, at more than 10 percent each over the decade. Illinois and Missouri, on the other hand, exhibited the District's slowest population growth rates, at less than 2.5 percent each. (See chart.)
Illinois and Missouri also experienced declines in shares of their population that are white. Still, white residents made up at least 80 percent of all District states' populations, except in Mississippi and Tennessee. In these two states, the share of the population that is white is less than 60 percent. Mississippi and Tennessee also have the largest shares of African-American residents, slightly less than 40 percent each. Shares of African-American residents in other District states vary—3 percent in Indiana and almost 16 percent in Arkansas, for example. All told, white and African-American residents comprise at least 95 percent of each state's population.
As in the rest of the country, the fastest growing segments of the District population are those groups that represent the smallest shares of total population. Three of these groups are Asians, native Hawaiians and Pacific islanders, and American Indians and Alaskan natives. In many instances, these groups more than doubled in size. Still, combined they currently comprise less than 5 percent of the population in each District state. About 1 percent of District residents classified themselves as being of more than one race, an option not available in the 1990 census.
The District's "Big" MSAs—The Economic Engines
The four major metropolitan statistical areas (MSAs) in the District are the driving forces of the region's economy. As in 1990, St. Louis is the largest MSA in the District, with a 2000 population of slightly more than 2.6 million people.3 Memphis is still the District's second-largest MSA, with more than 1.1 million people. Continuing to rank third and fourth are the Louisville area (more than 1 million people) and the Little Rock area (about 584,000 people).
Southern District cities—Little Rock and Memphis—grew faster than their northern counterparts—Louisville and St. Louis. Little Rock posted the fastest growth of the four over the decade, increasing its total population by 13.8 percent. Memphis' population grew by 12.7 percent. Louisville's 8.1 percent growth and St. Louis' 4.5 percent growth were significantly lower.
How do District metro areas fare against others in the country? When ranked by total population, St. Louis is No. 18 of the 280 MSAs in the United States. Memphis is No. 44, Louisville is No. 50 and Little Rock, the District's smallest "big" metro area, is No. 74. When ranked by growth in population, however, a different picture appears. Little Rock, the District's fastest growing major metro area, is No. 117 in growth nationwide. Memphis is No. 134, Louisville is No. 182 and St. Louis is No. 220. Looked at another way, the District's metro areas are relatively large in overall size (smallest is 74 out of 280), but relatively slow growing (fastest is 117 out of 280). For comparison, Las Vegas, the MSA that grew the fastest, saw its population increase a whopping 83.3 percent over the decade. By and large, the nation's metro areas that have experienced the fastest population growth are in the Southeast, Southwest and West.
In Little Rock, Louisville and St. Louis, more than 74 percent of each population is white; in Memphis, the share of white residents is 52.9 percent. All of these shares are down from their 1990 levels. The shares of residents in these areas that are African-American are up from their 1990 levels, with Memphis having the largest share—43.4 percent. In the other areas, the African-American population shares range from almost 14 percent in Louisville to almost 22 percent in Little Rock. Thus, as in the states and the District as a whole, white and African-American residents comprise more than 96 percent of the total populations of all of these metropolitan areas. The difference between the metro areas and states, however, is in the distribution—more evenly split in the urban areas than in the states.
Interestingly, the white population total in the St. Louis region was essentially unchanged (up 0.2 percent) between 1990 and 2000. St. Louis is the only District region where this occurred. In other words, the population growth there—though only 4.5 percent—resulted entirely from growth in other racial categories. Which category grew the fastest? In St. Louis, it was a combination of the Asian group and the native Hawaiians and Pacific islanders group.4 In fact, this combined category grew the fastest in all of the other MSAs, too, about doubling its population over the past decade.
The Nutshell Version
The District's population has grown slower than the nation's population over the past decade. This translates into a slower potential growth rate for the region's labor force, which could ultimately end up as a relatively slower rate of economic activity. Compared to the nation as a whole, whites and African-Americans make up a much larger share of the District's population. Other racial categories, however, are the District's fastest-growing.
Slow Growin' in the Eighth District
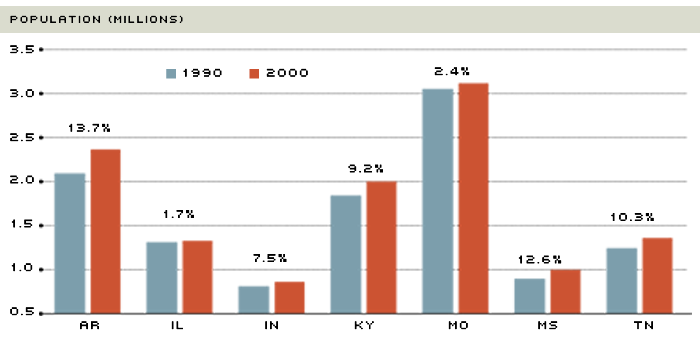
Except in Arkansas, population growth rates in District states were below the nation's, which was 13.2 percent. States in the southern part of the District—Arkansas, Mississippi and Tennessee—all grew more than 10 percent. Their northern counterparts—Illinois, Indiana, Kentucky and Missouri—grew less than 10 percent, in a couple of cases, substantially less. Will this affect future economic growth in the region?
NOTE: Only portions of states in the Eighth District are represented.
SOURCE: U.S. Bureau of the Census
Endnotes
- See the back cover of this publication for the boundaries of the Eighth Federal Reserve District. This article describes the population only within these boundaries. [back to text]
- Because of the way the census asked questions and the data that are currently available, those of Hispanic or Latino descent might be included in the white or African-American categories. [back to text]
- Because the geographic boundaries of MSAs change over time, part of the reported changes in populations can occur because of the addition or subtraction of counties from a region. By and large, though, the counties that are added or subtracted are small relative to the size of the region and have, at best, only a mild effect on the final numbers. [back to text]
- Actually, the category "other race" was the fastest growing, but because it encompasses a vast array of races and ethnicities, it is extremely difficult to pin down. The Asian group and the native Hawaiians and Pacific islanders group are combined to make a comparison with 1990 data possible; they were one group then. [back to text]
References
Engel, Charles, and John H. Rogers. "How Wide is the Border?" American Economic Review (December 1996), pp. 1112-25.
McCallum, John. "National Borders Matter: Canada-U.S. Regional Trade Patterns," American Economic Review (June 1995), pp. 615-23.
United States Trade Commission. "The Impact of the North American Free Trade Agreement on the U.S. Economy and Industries: A Three-Year Review." Investigation No. 332-81 (1997).
Wall, Howard J. "How Important is the U.S.-Canada Border?" International Economic Trends, Federal Reserve Bank of St. Louis (August 1999), p. 1.
Views expressed in Regional Economist are not necessarily those of the St. Louis Fed or Federal Reserve System.
For the latest insights from our economists and other St. Louis Fed experts, visit On the Economy and subscribe.
Email Us