


Inside the Briefcase: The Art of Predicting the Federal Reserve
The Federal Reserve is famously tight-lipped about its potential monetary policy moves. In desperate attempts to predict what Fed policy-makers are thinking, market-watchers occasionally resort to rather odd measures. For example, on mornings when the Federal Open Market Committee (FOMC) meets to debate on interest rate policy, the media often focus on the image of Fed Chairman Alan Greenspan carrying his briefcase into the front door of the Federal Reserve Board building.1 If the briefcase is bulging, so the theory goes, it is full of evidence gathered by Greenspan to persuade other members of the FOMC to vote for a higher interest rate target.2 If the briefcase is thin, then markets can relax because no change is likely.
Unfortunately for Fed watchers, the size of the briefcase is not always a good predictor of the Fed's actions. A look at the May 2000 FOMC meeting highlights this point. Despite the fact that Greenspan's briefcase that morning was reportedly at its thinnest in years, the FOMC raised its interest rate target by half a percentage point, its largest increase in five years. Therefore, it's not the size of the briefcase that matters, but the type and quality of the information found inside.
What is actually in the briefcase? Most likely, it is data released by government statistical agencies—information about labor markets, prices, industrial production, capacity utilization, business inventories, factory orders and shipments, etc. Most, if not all, of this information is already in the public domain. Because of the volume of data and its complexity, newsmakers tend to boil it down to just a few statistics, creating a simple picture that can help predict what the Fed will do.
Before trying to predict the Fed's actions, one must first understand the Fed's objective of promoting maximum sustainable growth in the economy. The Fed achieves this objective by supplying just enough money and credit so that the economy will operate at its potential without igniting inflation. However, at the time the Fed takes policy action, it does not know, and can only predict, the effects of its decisions on the future. The information in the Fed chairman's briefcase is used to make these predictions.
Because they are important measures of the Fed's beliefs, news agencies would like to report the policy-makers' forecasts, but such forecasts are available to the public only twice a year. Just prior to the FOMC meetings at the beginning of February and July, the Fed is required to provide its official economic forecasts in a report to Congress. For the other six meetings of the year, no Fed forecasts are made public. The public, instead, is left to glean the Fed's views by poring over Greenspan's speeches or analyzing the thickness of his briefcase.
Although the public seldom knows the Fed's forecasts of future inflation and GDP growth, it does have access to private sector forecasts. One popular forecast is the Blue Chip consensus, which pools the private forecasts of the country's leading business economists. These economists spend much of their time monitoring the same statistical agencies, whose output fills the chairman's briefcase. Because FOMC members and Blue Chip economists all observe the same statistical releases and use similar economic theories to interpret the data, one might guess that their forecasts are highly correlated with each other.
The Blue Chip consensus forecasts are released once a month, so there is always at least one new forecast before each FOMC meeting. The question, then, is how useful they are in filling the informational void created by the Fed's silence.
The Fed's Public Forecasts
Twice a year, the FOMC members, along with nonvoting Reserve Bank presidents, provide forecasts of nominal gross domestic product (GDP) growth, real GDP growth, inflation and the average level of unemployment. These forecasts are provided for six-, 12- and 18-month horizons into the future.
Of the four variables, real GDP growth and inflation are the ones to focus on because they best capture monetary policy objectives. If the economy achieves maximum sustainable growth, then unemployment can go no lower. And, by definition, if the Fed achieves its objectives for inflation and real GDP growth, it will have achieved the desired growth in nominal GDP.
To construct an official Fed forecast, individual Federal Reserve officials are asked for their economic forecasts prior to the February and July FOMC meetings, based on their judgment about the appropriate policy for the coming year. The projections are then reported to Congress as a range, listing the high and low values for each item, as well as a central tendency, which omits extreme forecasts and is meant to be a better representation of the consensus view.
Reading the Fed's Mind
Comparing February and July Blue Chip forecasts to the Fed's semi-annual forecasts can show how well the Fed's views are captured by the private sector. The Blue Chip forecasts are collected on the first three working days of the month and the information available to private sector economists is approximately the same as the information available to FOMC members when they make their forecasts. Most important, both groups have the latest information on the price indexes from the Bureau of Labor Statistics and the most recent report on actual GDP from the Bureau of Economic Analysis.
The accompanying figures on this page show the consensus GDP growth and inflation forecasts for the Fed and Blue Chip economists, taken between 1983 and 2000. The consensus Fed forecast is defined here as the midpoint of the central tendency range.
Figure 1: A Peek Inside the Briefcase
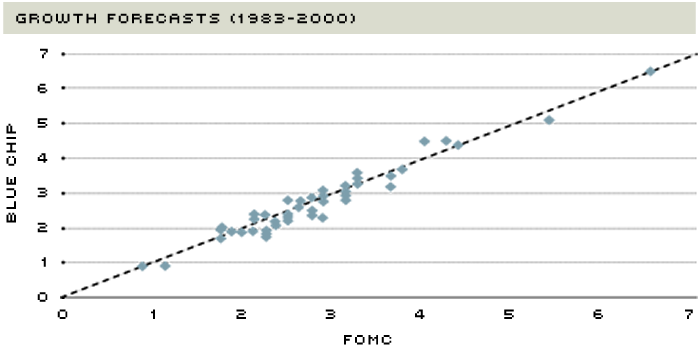
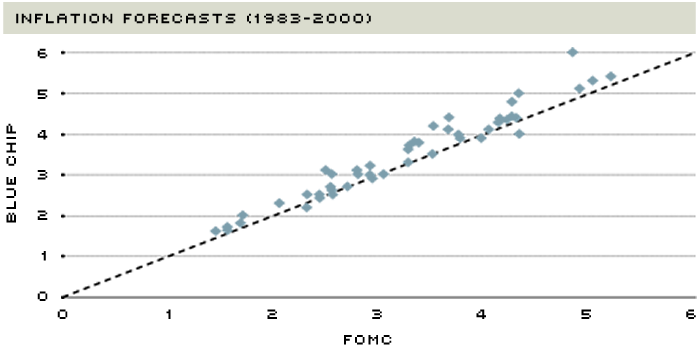
Figure 2
The Fed's twice-a-year public forecasts of growth and inflation are highly correlated with the Blue Chip consensus forecasts. So, for the rest of the year, when the Fed's forecasts are not public the Blue Chip consensus is a useful substitute.
If the Fed and Blue Chip forecasts were exactly the same, they would lie on the 45-degree line shown. As Figure 1 shows, the forecasts were quite similar and seem to be distributed evenly above and below the 45-degree line. That is, there doesn't seem to be any tendency for the Blue Chip economists to systematically forecast more or less output growth than the Fed does.
The same cannot be said of inflation forecasts. As bottom Figure 2 shows, Blue Chip economists usually forecasted higher inflation than the Fed did. This is illustrated by the fact that most of the points lie above the 45-degree line. The period from 1983 to the present has been a period of moderate and falling inflation. Throughout, the Federal Reserve has had a public goal of eliminating inflation. In general, the Fed's forecasts of inflation have been better than the Blue Chip forecasts. However, as inflation became lower in the 1990s, the forecasts have converged, indicating that the private sector has gained confidence in the Federal Reserve's ability to deliver low inflation. So, although the Blue Chip inflation forecasts have not always been good indicators of the Fed's inflation forecasts, they have been better in recent years.
Beyond the Briefcase
Knowing the forecasts and the latest information about the economy—that is, the contents of the briefcase—is not enough to predict what the FOMC will do with policy. Policy will change when GDP growth and inflation stray from the Fed's objectives. Since the Fed does not set specific objectives for these measures, people use the forecasts and the deviations of actual inflation and growth from the forecasts as tea leaves for reading the Fed's objectives.
For example, the best long-term forecast of real GDP is the trend growth in potential GDP. This measure aligns closely with the Fed's objective to keep the economy growing along its potential. If actual GDP is above potential GDP, economists will tend to believe that it is unsustainable and expect the Fed to adopt a tighter policy in order to prevent future inflation.
The Fed's long-term forecast for inflation is often treated as an estimate of the Fed's policy objective because monetary policy is the primary determinant of inflation in the long run. If inflation comes in above this forecast, people will expect the Fed to tighten policy. If the Fed does not tighten policy, people will tend to believe that the Fed's inflation objective has risen.
Sometimes, monetary policy is relatively straightforward. For example, if output and inflation are both coming in above expectations, then FOMC members and the marketplace are likely to agree that the Fed must tighten policy. Similarly, if inflation and GDP growth are both coming in below expectations, then the market should not be surprised to see the Fed ease its policy stance.
The more difficult cases occur when GDP growth and inflation surprise us in opposite directions. If growth is weaker than expected and inflation turns out to be surprisingly high, there will be tension between those who want to fight inflation and those who want to stimulate growth. Conversely, with surprisingly high growth and unexpectedly low inflation, some will want to raise interest rates because they fear that the rapid growth is not sustainable, and that a failure to tighten policy now will lead to higher inflation down the road. Others will note that inflation is below expectations, so why not wait for more information before changing the policy stance. This dilemma is discussed in the accompanying sidebar.
To Watch the Briefcase or Not?
Private sector forecasts, such as the Blue Chip consensus forecasts, are useful summaries of incoming information about the economy and good proxies for the Fed's forecasts. One lesson to draw from this is that we can have a pretty good idea of what is "in" the briefcase, making the veil of secrecy shrouding FOMC meetings a bit more transparent.
It is important to note, however, that since 1994, knowing what is in the briefcase has not been much help in predicting policy actions because the incoming data point the Fed in different directions. Ordinarily, good news on high growth would suggest the need for a more restrictive policy. At the same time, the good news on low inflation would suggest that an easier policy stance might be preferred. Only recently, in the first quarter of the year 2000, has the message become consistent: The combination of unexpectedly high GDP growth and surprisingly high inflation indicates a need for tighter policy.
When GDP Growth and Inflation Send Mixed Signals
There are times when the Fed's policy actions are relatively easy to predict, and times when it is far more difficult. Plotting the forecast errors for GDP growth and inflation can give us some graphical insight as to how the Fed reacts to different situations.
Figure 3 shows forecast errors for inflation and real GDP growth. The forecast errors are constructed by subtracting the latest Blue Chip forecast from the relevant quarter's advance report on actual GDP growth. The actual GDP growth rate that the Blue Chip forecasts are compared to in each quarter is based on the most recent estimate available from the government at that time.
Because it takes the Bureau of Economic Analysis a good bit of time before it can release an accurate final estimate of quarterly GDP growth, advance estimates are issued in the first month immediately following the end of a quarter. These advance estimates contain most of the information about GDP and are hardest to forecast. Two revisions, preliminary and final, are released in the second and third month after the end of each quarter. For example, advance first-quarter estimates are issued in April, preliminary estimates are issued in May, and final estimates are issued in June. Therefore, when advance data for the second quarter is released in July, the available GDP growth estimate for the calendar year includes the final estimate for the first quarter and the advance estimate for the second quarter. A positive forecast error in July would indicate that at that point in time, the available GDP growth estimate is above the Blue Chip forecast for the year.
Figure 3: What Will the Fed Do?
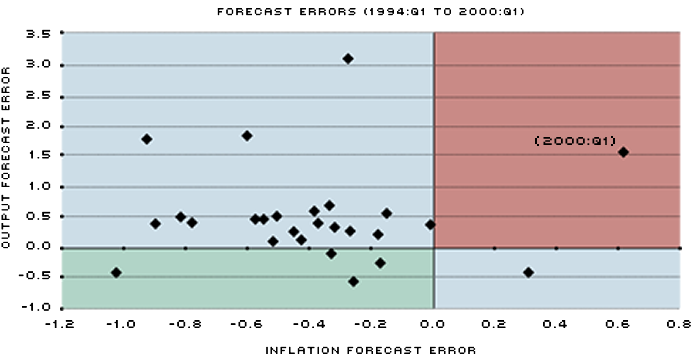
When the forecast errors for inflation and GDP growth have the same sign, that is, when the points lie in the green or red quadrants, the implications for monetary policy are clear. When they have opposite signs—the blue quadrants—as has been the case for most of the time since 1994, there are conflicting signals about what the Fed will do.
The forecast errors should reflect the new information contained in the GDP report. In the case of GDP growth, if the forecast errors are positive, by implication GDP may be growing faster than the estimate of potential. If the forecast errors are negative, by implication GDP is likely to be growing below potential.
If both forecast errors are positive—that is, if inflation and growth are both unexpectedly high—then the points will lie in the red region of the figure, indicating the need for a tighter policy. If both forecast errors are negative, indicating surprisingly slow growth and low inflation, then the points will lie in the green sector, suggesting the need for a looser policy. If the points lie in the other two blue quadrants, where one forecast error is positive and the other is negative, there is no clear indication for policy.
Since the beginning of 1994, GDP growth forecast errors (measured on the vertical axis) have tended to be positive, mainly lying above the horizontal axis. Generally, the inflation errors have been negative, with the points lying to the left of the vertical axis. In the majority of the cases, then, the forecast errors have been in the blue area, where growth is surprisingly high and inflation is surprisingly low. Therefore, since 1994, it has not been clear what, if anything, should be done with monetary policy. In fact, since 1994, the first quarter of 2000 was the only instance in which forecast errors for both inflation and GDP growth were positive (that is, in the red sector). So we should not be surprised that the Fed would see the need to tighten monetary policy.
Endnotes
- In fact, CNNfn.com updates its "Eyes on the Fed" section with commentary and pictures of the chairman's briefcase on the mornings of FOMC meetings at http://cnnfn.com/news/specials/eyes_on_fed/. [back to text]
- The FOMC consists of the Board of Governors of the Federal Reserve System (seven governors) and five of the Federal Reserve Bank presidents. The president of the New York Fed is the vice chairman of the committee and always votes. The other four voting positions rotate among the other 11 Reserve Bank presidents. [back to text]

Views expressed in Regional Economist are not necessarily those of the St. Louis Fed or Federal Reserve System.
For the latest insights from our economists and other St. Louis Fed experts, visit On the Economy and subscribe.
Email Us