


Drive to Efficiency Leaves Smallest Banks Behind
U.S. banks enjoyed record profitability during the latter half of the 1990s, due in large part to the economy's outstanding performance. Fierce competition, however, is forcing them to trim costs to maintain those profitability levels. Although banks so far have kept a lid on loan rates to avoid turning customers away, a dearth of deposits has forced them to bid up the cost of funds.1 As a consequence, the net interest margin (the difference between interest income and interest expense, divided by average earning assets) at all U.S. banks declined 25 basis points between year-end 1994 and year-end 1998.2 To maintain profitability, banks have begun slashing overhead expense and increasing fee income—the two categories least affected by interest rates.
The nation's small banks (those with assets less than $100 million) have been less successful than midsized banks (those with assets between $100 million and $1 billion) in reducing overhead and generating nontraditional revenue sources.3 Consequently, profitability at America's small banks has lagged behind that of midsized institutions. At small banks, return on average assets (ROA)—the most common tool to assess bank profitability—measured 1.11 percent at year-end 1998, which was 19 basis points below the average midsized bank ROA. Why are these small banks having a tougher time?
Mid-sized Banks Become More Fuel Efficient
SOURCE: FFIEC Reports of Condition and Income for Insured U.S. Commercial Banks, 1994-98
A Tour of District Overhead Trends
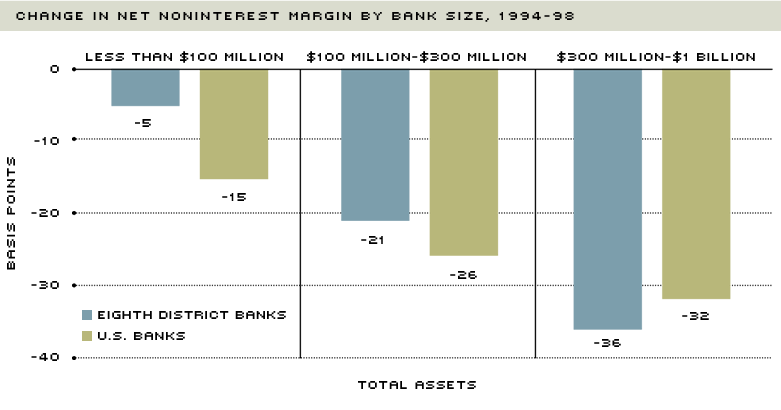
In general, Eighth District banks succeeded in trimming the net noninterest margin (noninterest expense less noninterest income, divided by average assets) during the last five years. A lower net noninterest margin implies that a bank has either lower overhead, higher noninterest (fee) income, or both. Between 1994 and 1998, the net noninterest margin for District banks with less than $1 billion in assets declined from 2.19 percent to 1.99 percent.
Despite the increased importance of fee income at U.S. banks overall, noninterest income has been relatively unimportant in reducing the District's average net noninterest margin. Specifically, noninterest income as a percentage of average assets has been nearly flat at small and midsized District banks, rising just 4 basis points to 0.85 percent between 1994 and 1998. In contrast, noninterest income for all U.S. small and midsized banks increased 11 basis points to 1.23 percent of average assets over the same period.
Noninterest income is made up of deposit service charges, trust activities income, trading revenue, other fee income, and a catchall category aptly referred to as "other noninterest income." Since 1994, deposit charges (including ATM and bounced-check fees), trust income, trading revenues and other noninterest income have been largely stagnant at small and midsized banks, both in the District and throughout the nation. What has been separating the District from all U.S. banks, then, is the District's lack of "other fee income" growth. This income category includes mortgage servicing fees, credit card fees, early withdrawal penalties, safe deposit box rentals and loan commitment fees.
One explanation for the lagging District noninterest income is the amount of credit card fees, which are directly related to the level of credit card loans held in bank portfolios. Since 1994, small and midsized District banks have drastically reduced the amount of credit card loans in their portfolios, thereby reducing the fees generated from such loans. U.S. small and midsized banks have not made similar reductions in credit card loans, possibly because credit card lending is becoming increasingly consolidated in major financial centers, and banks in those centers are purchasing Eighth District credit card portfolios.
Although fee income has increased slightly, the true driving force behind the drop in the District's net noninterest margin is a decrease in noninterest expense. As a percentage of average assets, noninterest expense at District banks fell 16 basis points to 2.84 percent between 1994 and 1998. It should be noted that during that five-year period, personnel and occupancy expenses remained stable. District banks, therefore, achieved cuts in overhead by aggressively targeting "other noninterest expense." This category includes a host of costs, such as FDIC insurance premiums, advertising costs, data processing services, software development costs and certain legal fees.4 Although it is impossible to pinpoint the sources of the cost savings precisely, one likely candidate is the outsourcing of services, such as information technology and auditing, which were formerly performed in-house.
Why Are Small Banks Sputtering?
Despite the overall gains in reducing the net noninterest margin, small District banks have not enjoyed equivalent cost savings. At 2.21 percent, the net noninterest margin at the smallest District banks was considerably above that (1.89 percent) of District midsized banks at year-end 1998. The margin fell just 5 basis points at small banks between 1994 and 1998, compared with a dip of 26 basis points at midsized banks, leaving 1998 ROA at 1.05 percent for small District banks and 1.29 percent for midsized banks.
The efficiency ratio also highlights small banks' struggle to contain overhead costs. This ratio is calculated by dividing noninterest expense by the sum of noninterest income and net interest income. An efficiency ratio of 60 percent, for example, means that a bank is spending 60 cents to generate a dollar of income. Declining efficiency ratios, therefore, signal a reduction in overhead relative to income. Although the average efficiency ratio for District banks with less than $1 billion in assets declined from 61 percent in 1994 to 59.4 percent in 1998, the entirety of this efficiency gain came from midsized banks. Efficiency ratios at small District banks, meanwhile, actually increased from 61.7 percent to 62.9 percent between 1994 and 1998, implying an increase in net overhead costs relative to operating revenue during the period.
The slow decline in the net noninterest margin at the District's smallest banks is due to two factors. First, noninterest expense at the District's smallest banks has declined more slowly than at midsized banks. Small banks trimmed "other noninterest expense" by 12 basis points over the last five years. In contrast, District midsized banks cut other noninterest expense 27 basis points over the same five-year period. Although advances in technology have enabled many institutions to cut operational costs, small banks are often unable to invest the large amounts of capital needed to implement the latest innovations, leaving them less able to reap related financial benefits.
The second factor hampering the District's smallest banks is a lack of fee income growth. While midsized banks increased their fee income just 3 basis points to 0.95 percent of average assets between 1994 and 1998, small banks' noninterest income remained unchanged at 0.63 percent. Flat fee income reflects small banks' practice of underpricing services relative to their administrative costs because bankers fear that high fees will offend their customers. Small banks also do not offer the range of sophisticated products like trust and brokerage services that generate fee income for larger banks because they lack the personnel expertise and sales volume to exploit economies of scale.
Will Small Banks Be Able to Drive On?
Asset quality remains the bedrock of bank stability, and small banks with sound loan portfolios will begin the 21st century in excellent shape, despite their lower profitability. Many small banks are reluctant to push their efficiency ratios lower by reducing staff. Community bankers argue that the higher staffing costs are needed to maintain the personalized service that sets small banks apart.5 Although earnings at small banks may continue to lag those at midsized banks, consumer demand for personal attention should help to ensure a place in the future for community-focused banks.
Endnotes
- See Neely (1998). [back to text]
- Data are from the Federal Financial Institutions Examination Council (FFIEC) Reports of Condition and Income for Insured U.S. Commercial Banks. The data exclude bankers' banks, nonbank banks, credit card banks and other special status banks. All data are year-end. [back to text]
- Definitions of small and midsized banks vary industrywide; they are defined here according to trends in net noninterest margins. This analysis excludes large banks—those with more than $1 billion in assets—since product lines and cost structures at these banks differ significantly from those at smaller banks. Moreover, the small number (17) of District banks with assets greater than $1 billion makes changes in statistical aggregates suspect. Small and midsized banks accounted for 46 percent of all District bank assets in 1998. [back to text]
- Banks have little control over deposit insurance premiums, which are mandated by the FDIC. [back to text]
- See Kimelman (1999). [back to text]
References
Kimelman, John. "Community Banking Quarterly: Smaller Banks Reluctant to Push Efficiency Ratio," American Banker (March 15, 1999).
Neely, Michelle Clark. "Both a Lender and a Borrower Be: Banks Cope with a Deposit Shortage," The Regional Economist, Federal Reserve Bank of St. Louis (January 1998), pp. 12-13.
Views expressed in Regional Economist are not necessarily those of the St. Louis Fed or Federal Reserve System.
For the latest insights from our economists and other St. Louis Fed experts, visit On the Economy and subscribe.
Email Us