


Restructuring And Economic Growth: Taking The Long-Term View
"No matter how refined and how elaborate the analysis, if it rests solely on the short view it will still be... a structure built on shifting sands."
—Jacob Viner1
One economic development we've heard plenty about lately is restructuring. In fact, restructuring—literally, a structural change in the economy—has become a catch-all term to explain the relatively weak pace of economic growth and job creation during the current expansion. In economic terms, however, restructuring is more like the process of natural selection. As the economist Joseph Schumpeter has noted, in a dynamic economy, the forces of "creative destruction" ensure that evolution in products and production processes occur on a continuing basis. That the U.S. economy no longer relies on stage coaches, blacksmiths, or other goods and services from a bygone era is a testament to this evolution, brought about by the powerful forces of innovation and entrepreneurship.
Unfortunately, in talking about restructuring, analysts tend to overemphasize month-to-month or quarter-to-quarter movements in important economic statistics like payroll employment or gross domestic product (GDP). As a result, economists who form their opinions about economic prospects on the basis of a singular report frequently miss the mark. Recognizing the weakness of this analysis, the late economist Jacob Viner urged his colleagues to look carefully at the underlying long-run trends inherent in the data. Unfortunately, Viner's warning is too often ignored.
An Old Saw Or a New Cudgel?
When discussing the effects of economic restructuring, one must distinguish between changes in economic activity that are transitory in nature and those that are permanent. For instance, during the course of the business cycle, short-term economic disturbances typically arise from financial market stress. More often than not, these disturbances adversely affect such interest-sensitive sectors as manufacturing or construction, causing the demand for certain goods and services in these sectors to wane. Firms, facing a reduction in sales, attempt to reduce costs by temporarily curtailing production and reducing employment. Structural adjustments, on the other hand, tend to accumulate over horizons measured in years—not months or quarters. This is so because most structural adjustments are driven by technological innovations—such as new production processes or advances in knowledge and materials—and may accordingly take a long time to develop.
Structural changes may also manifest themselves in the form of changes in the labor force or certain government-mandated institutional changes that permanently distort the allocation of labor and capital.
A good example of a structural change is the evolution of the United States from an inherently agricultural-based economy to its current service-based structure. Until the mid-1800s, the United States was primarily an agrarian society composed of small farmers and shopkeepers. With the advent of the Industrial Revolution just after the Civil War, the country began to evolve into a manufacturing-based economy. Innovations like the camera, typewriter and sewing machine came about in the 1880s, as did a proliferation of branded and packaged consumer products. These innovations—as well those that followed—necessarily entailed adjustments in production processes and raw materials acquisition. As new products evolved and the relative demand for many goods and services changed, certain types of jobs were created while others were eliminated. Despite the transition costs of increased unemployment and declining wages in those industries that fall by the wayside, this process is both necessary and desirable. In other words, reorganizations of economic activity provide the foundation for economic growth in the long run.
One economic fallacy that seems to flourish is that the U.S. manufacturing sector—America's sinew and muscle, so to speak—is withering away. As with any economic fallacy, a grain of truth masks the reality. In this case, the grain of truth is that the United States has indeed become a nation of service-sector employees. The reality, however, is that manufacturing employment has been declining as a share of total employment for decades (see Figure 1).
U.S. Nonfarm Employment
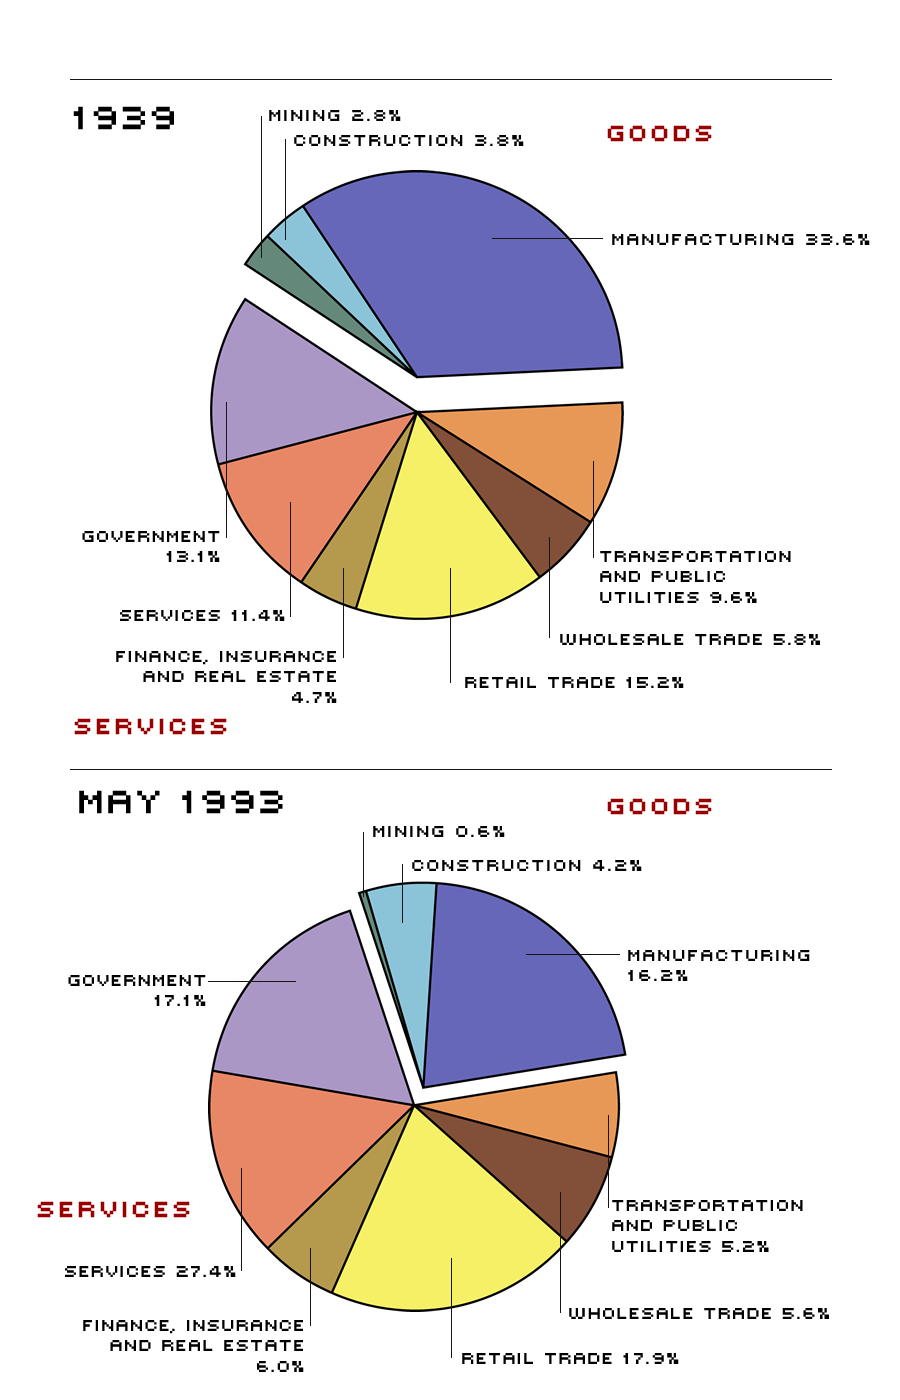
The pies above show how the composition of U.S. nonagricultural payroll employment has changed. Two characteristics are worth noting. First, before World War II, about two of every four nonagricultural jobs nationally were in goods-producing industries; today it is only half that. Second, employment in services-producing industries has increased from about 60 percent of nonfarm employment in 1939 to its current 79 percent, although this trend actually began much earlier. Indeed, in 1870 services-producing employment constituted only 24 percent of civilian employment, goods-producing employment was another 25 percent, and the remaining 50 percent was ensconced in agriculture.* Although District employment data begins only in 1972, the trends are similar.
* See Ott (1987).
The real fallacy of the view that the U.S. manufacturing sector is in a free-fall, however, can be revealed by looking at the output of the manufacturing sector as a share of aggregate U.S. output (GDP) over time. Although highly cyclical, real manufacturing output for the U.S. has stayed relatively constant as a percent of total output in the post-World War II period, usually fluctuating between 20 and 23 percent. Despite recent data revisions which show manufacturing output at roughly 19 percent of total output, there is scant evidence to support the assertion that manufacturing output as a share of total output is in a long run decline.
How did manufacturing output stay relatively constant as a share of total output over time with a declining share of labor? Continual increases in worker productivity. Productivity gains in the manufacturing sector eventually led not only to a higher standard of living for those workers, but also to a shift of resources from manufacturing into services. This movement directly parallels the movement of resources out of the agricultural sector that took place years earlier.
These trends in employment and output demonstrate that restructuring involves a reallocation of economic resources over time. If an economy did not continually restructure, economic sclerosis would eventually set in, stifling economic growth and reducing living standards.
Past and Present Restructuring Efforts
Economic growth and job creation during the current expansion has been weak relative to previous expansions. What is less clear, however, is the cause or causes of this development and whether it reflects any long-run trend. Nevertheless, restructuring seems to be a popular explanation. There are several derivatives of this hypothesis. Some allude to the accumulation of private and public debt in the 1980s and its alleged deleterious effects on current consumption and investment; others point to the overbuilding in the commercial real estate sector from the early to mid-1980s and its subsequent reversal. Most, however, focus on two specific "events": the downsizing in the defense sector in response to the Soviet Union's demise and the downsizing in corporate America. Although this article will primarily focus on those two explanations, it will also examine two additional factors that many have overlooked.
Downsizing in Defense: Have We Marched Down this Road Before?
As the Cold War ended, many policymakers envisioned an opportunity to shift resources away from national defense to other domestic purposes. What few acknowledged, however, was that defense spending as a share of national income was already at relatively low levels to begin with, as real defense purchases have trended downward as a share of GDP since the Korean War ended in the early 1950s (see Table 1).
Output and Employment During the Three Post-World War II Defense Build-downs
| Real Defense Purchases (Billions of 1987 Dollars) | Share of Real GDP | Defense Employment (Thousands)1 | Percent of Nonagricultural Payroll Employment | |
|---|---|---|---|---|
| Korean War | ||||
| 1953 | $224.6 | 13.4% | 8,977 | 17.9% |
| 1958 | 184.9 | 10.2 | 6,469 | 12.6 |
| Percent Change | –17.7 | –3.22 | –27.9 | –5.32 |
| Vietnam War | ||||
| 1968 | $248.6 | 9.0% | 7,955 | 11.6% |
| 1973 | 190.2 | 5.9 | 5,100 | 6.6 |
| Percent Change | –23.5 | –3.12 | –35.9 | –5.02 |
| Post-Cold War | ||||
| 1987 | $290.2 | 6.5% | 6,657 | 6.5% |
| 1992 | 262.2 | 5.4 | 5,802 | 5.4 |
| Percent Change | –9.6 | –1.12 | –12.8 | –1.12 |
In 1953, defense-related employment represented almost 18 percent of total nonagricultural employment, and real defense spending was just over 13 percent of real GDP. By contrast, defense-related employment as a percent of total nonfarm employment was substantially less in 1968 (Vietnam) and in 1987; the same can be said for real defense spending as a share of real GDP. The table also shows that the percentage decline in real defense spending since 1987 is significantly smaller than after Korea or Vietnam.
NOTE: This table is adapted from Lowenstein and Peach (1992). Years are measured on a fiscal basis; for example, 1953 is the four quarters from IV/1952 to III/1953.
1Defense-related employmet consists of those active-duty military personnel, full-time reserves, national guard, civilian employees of the Department of Defense, and those in the defense industry as designated by the Department of Defense.
2Percentage-point decline.
During the Korean War, real defense spending rose at a 64.3 percent annual rate from II/1950 to IV/1952, or from just over 4.5 percent of GDP to 13.5 percent. After the war's end, real defense spending declined precipitously, falling at a 9.4 percent rate over the 12 quarters ending in IV/1955. A second major decline in defense spending occurred after the Vietnam War buildup. During this buildup, real defense purchases rose at a 13.3 percent rate, climbing from 7.2 percent of GDP in early 1965 to 9.1 percent of GDP by mid-1968. But as U.S. involvement in Vietnam ebbed, so did defense spending. Eventually, defense spending fell to 4.8 percent of GDP in late 1978, its lowest level in 30 years.
A third major decline in post-World War II defense spending is going on today. What distinguishes this episode from the previous two is the duration and relative moderation of the preceding buildup: Real defense spending rose from 4.8 percent of real GDP in IV/1978 to 6.4 percent of GDP in IV/1982, eventually peaking at 6.7 percent of GDP in III/1986—a 14-year high.
The largest declines in defense spending during the current builddown have taken place since the end of the recession in I/1991, with real defense purchases having fallen at a 6.8 percent annual rate. This decline cannot compare with the downsizing in the aftermath of the Korean or Vietnam Wars, however, when defense was a much larger component of the economy at the height of the conflict and decreases in defense spending occurred at much faster rates. Moreover, the previous two episodes had much larger effects on output and employment. Table 1 provides some evidence to support this assertion.
One might also expect further reductions in military spending in the future. Preliminary budget estimates out to 1997 show projected defense spending falling to near or below historical levels. Because of this, as a recent Bureau of Labor Statistics study predicts, defense-related employment will fall by an additional 1.9 million from 1992 to 1997, with roughly one third of the losses occurring in the manufacturing/transportation sector and another third coming primarily from the armed services.2 In sum, defense-related employment is expected to decline by nearly 2.8 million from 1987 to 1997. Although this is comparable to earlier episodes numerically, the percentage of workers affected is smaller.
Corporate Downsizings: No Pain, No Gain
Another facet of restructuring today is reflected in corporate downsizing (see Chart 1).
The thrust of most downsizing efforts is to reduce the workforce and, thereby, costs. Firms engage in these activities for many reasons: to boost productivity, relocate a plant or transfer production, automate (replacing labor with machines), merge with or acquire another firm, or close an obsolete plant. Even such stalwart companies like IBM, General Motors, and Sears have had to restructure their operations recently—trimming their payrolls by thousands and closing factories and stores—in an effort to reduce costs and boost competitiveness. Although the AMA study found that they did not always accomplish their stated goals, sometimes instead ending up with reduced productivity, lower profits and damaged worker morale, firms across the spectrum are still trying to do more with less.
Corporate Downsizing: The Five-Year Trend
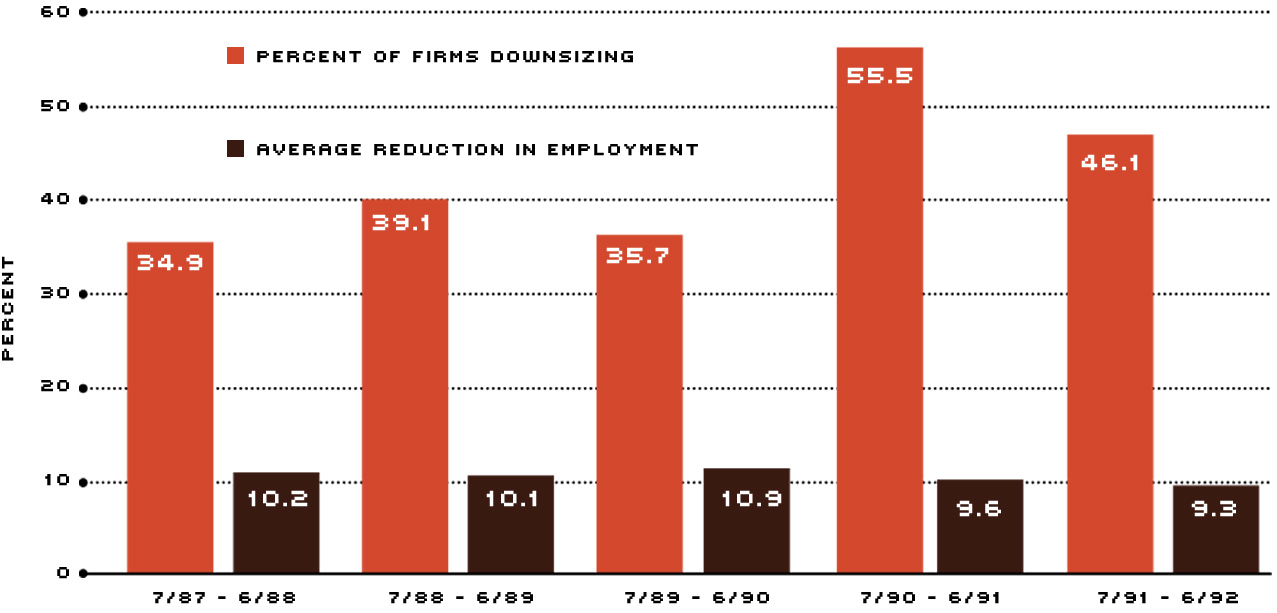
According to the American Management Association (AMA), the latest round of downsizing began about six years ago and reached its peak in the 1990-91 period, when over half of all companies surveyed reported some form of corporate restructuring.* Given that the relatively large percentage during this survey period corresponded with the last recession, an upward bias was probably imparted in the number. The average yearly employee reduction by each surveyed firm from mid-1986 to mid-1992 was approximately 10 percent. With the end of the recession and a resumption of economic growth, however, this percentage has declined somewhat, falling to 9.3 percent for the year ending in June 1992. Nevertheless, many firms continue to trim their payrolls.
* See Management Association (1992)
Corporate downsizing used to hit production workers the hardest; recently, service-sector workers have also become vulnerable. Some attribute this to an ascent trend called "re-engineering" or "lean production."3 Essentially, this process is an effort to consolidate the responsibilities of several workers into a single worker or team of workers, pushing decisionmaking as far downstream as possible. The end result is that certain middle managers become redundant.
Lean production hinges on a firm's ability to synthesize information-based technology (for example, computers and software). For example, innovations in software applications enable one individual to design, coordinate and produce a document that additionally required both a secretary and a graphic artist previously. The rise of just-in-time inventory management is another application of this technology. The effects of these trends can be seen clearly in the tremendous rise of business investment in personal computers, word processors and other office equipment, which has risen from 0.7 percent of GDP in 1968 to 3.6 percent of GDP today.
Unlike the consolidation in defense, which affects a relatively small percentage of the economy, the application of lean production could affect a much larger segment of the economy. Some analysts predict this process will displace nearly 25 million workers—almost 25 percent of total nonagricultural employment—and boost the unemployment rate to as high as 10 percent by the end of the decade.4 Economists would probably challenge such an assertion. For example, just as few had the foresight to predict the Industrial Revolution and the transformation of the American economy more than 100 years ago, so too did few anticipate 15 to 20 years ago the ramifications of today's personal computer in the information age. Similarly, if allowed to function properly, the market of tomorrow will unleash forces that few will have predicted today.
Whatever the innovation, downsizing efforts are part and parcel of an ongoing trend in industrial economies. Although we could mention several candidates over the past 20 years or so, the steel and auto industries come readily to mind. These earlier efforts entailed significant employee dislocations and transition costs. Nonetheless, they produced desirable outcomes for the principals involved—as well as for the economy as a whole.
Case Study: Previous Restructurings
Recall that during the late 1970s, auto analysts were referred to the Big Three auto makers as the "Big Two and a Half." Chrysler appeared on the ropes—some even predicted its demise—and Ford was showing signs of strain. High and rising inflation, rising energy prices, increased environmental regulations and strong import competition portended rough times ahead. By December 1979 a total of 100,000 auto workers were on "indefinite" layoff and another 40,000 were on "temporary" layoff. Against this panoply of problems, Chrysler and Ford aggressively downsized their operations to compete with GM and foreign auto makers. Eventually, employment by the Big Three automakers would drop by 33 percent—or 385,000 workers—from 1980 to 1991.5
If the domestic auto industry appeared to be on its knees by the early 1980s, the domestic steel industry was down for the count. Much of the industry employed technology that had changed little from the early 1900s.6 In a highly competitive world market that saw foreign producers continually employing the latest technology, domestic steel producers found themselves waging a battle they were ill-equipped to fight. For instance, from 1973 to 1980, employment in the domestic steel industry declined from 509,000 to 399,000. By December 1979 U.S. Steel had announced it would close nearly all 16 of its operations. Many in the domestic steel industry thus believed themselves on the road to extinction and petitioned the U.S. government for protection from foreign steel producers. The resulting outcry produced the "Voluntary Restraint Agreements" and the "Trigger Price Mechanism." In the end, however, the domestic steel industry began to re-energize itself through "de-integration"—a movement away from its traditional vertically integrated structure.
With the benefit of hindsight we can see that these restructuring efforts—while painful at the time—produced positive effects in the long run. Ford and Chrysler are strong competitors both domestically and internationally. General Motors, while lagging the field somewhat, has also recognized the benefits of restructuring. Despite the inevitable costs involved, its decision to close approximately 28 plants and lay off at least 75,000 workers by 1995 is a testament to the discipline market forces can have on an inefficient competitor. Similarly, the domestic steel industry has also benefited. Although the largest and best-known steel producers continue to consolidate operations, several new firms with advanced technologies have appeared in their stead. Those that have flourished are the so-called mini-steel mills. These mills, which turn scrap iron into finished steel and steel products, have become important players, garnering nearly 25 percent of the domestic market share. Among these producers is Nucor, which has invested heavily in the northwestern part of Arkansas and has been described as one of the lowest-cost producers in the world.
In the final analysis, companies must restructure when the competition begins to get the best of them. If there are underlying long-term forces at work in the economy that tend to reduce the demand for certain products or services, attempts to circumvent these forces will be misguided. For example, most economists would argue that interventionist policies that shield domestic producers from foreign competition actually harm those they are intended to help. By delaying innovation and masking inefficiencies, these government actions provide the wrong incentives, distort necessary resource reallocations and postpone the inevitable.
Neglected Structural Adjustments?
As we have seen, restructuring can involve technological or managerial changes that permanently alter the manner in which production takes place, or it might involve large-scale sectoral shifts in economic resources. Restructuring may also take other less apparent forms. Two trends that have received substantially less attention than defense cuts and corporate downsizing is the slowing in labor force growth over the past 15 years and the apparent reversal of the trend toward deregulation that occurred from 1977 to 1988.
Slowing Labor Force Growth
As we have discussed, many observers pointed a finger at the slow employment growth during the current expansion as an indication of structural weakness in the economy. The U.S. economy has experienced these types of changes before, however, with no permanent debilitating effects. While not in the classic mold of our previous examples, labor force growth nevertheless affects the economy's long-term potential because the number of people entering the work force ultimately determines the level of demand for goods and services.
Compared with previous post-World War II recoveries and expansions, the growth of the civilian labor force in recent years has been weak. From 1979 to 1992, the labor force has expanded at a 1.6 percent annual rate, substantially less than the 2.4 percent rate that prevailed from 1963 to 1978. Although it rebounded somewhat from 1983 to 1989, rising at a 1.8 percent rate, labor force growth has once again slowed considerably, rising at only at a 0.7 percent rate since IV/1989. While weak labor force growth can soften the blows of other restructuring efforts, it may also exert a broad, long-term negative influence on the housing sector or certain other producers.
Increasing Regulatory Burdens
Excessive regulatory burdens may also be hampering economic growth. From the late 1970s to the late 1980s, the federal government made a concerted effort to unwind some of the regulatory excesses that had built up over time. It was generally recognized that deregulation would promote increased economic efficiency by freeing up resources that might otherwise be used elsewhere. Since 1988, however, a sea change in the regulatory environment seems to have occurred. From 1977 to 1988—the peak deregulation period—regulatory costs were estimated to have declined by more than 1 percent a year. From 1988 to 1992, however, this trend was reversed, as costs have risen at an estimated 2.3 percent to 2.7 percent per year. In 1992, total regulatory costs were estimated to be between $413 billion and $533 billion (1988 dollars).7 Although we can never know the exact cost to society in lost output, most economists concede that excessive regulatory burdens produce inefficiencies, thereby affecting the long-run growth potential of the economy.
Conclusion
The unusually weak economic expansion following the recent recession has provoked considerable discussion about its causes and consequences. Many of the discussants lay the blame at the feet of economic restructuring. What they generally do not acknowledge, however, is that restructuring is an ongoing and in many ways unanticipated process, generating changes that affect employment and economic growth in positive ways over the long haul. While substantial transitional costs are inevitable, historical precedent suggests that restructuring more often than not leaves the economy better off than it was before. Accordingly, policies designed to counter or reverse these trends may be misguided if not conceived within a long-run framework that acknowledges the dynamic qualities of the U.S. economy.
Endnotes
- See Baumol, Batey and Wolff (1991), p. 9. [back to text]
- See Saunders (1993). [back to text]
- See Womack, Jones and Roos (1991). [back to text]
- See Ehrbar (1993) and Zachary and Ortega (1993). [back to text]
- See Ballew and Schnorbus (1993). [back to text]
- See Burnham (1993). Much of the following discussion is derived from there. [back to text]
- These numbers are estimated by Hopkins (1991) and exclude the 1990 Clean Air Act Amendments. [back to text]
References
American Management Association. 1992 AMA Survey on Downsizing and Assistance to Displaced Workers, Eric Rolfe Greenberg, ed. (1992).
Baumol, William J., Sue Ann Batey Blackman, and Edward N. Wolff, ed., Productivity and American Leadership, (MIT Press, 1991).
Ballew, Paul D., and Robert H. Schnorbus. "Auto Industry Restructuring and the Midwest Economy," Chicago Fed Letter, Federal Reserve Bank of Chicago (June 1993).
Burnham, James B. "Changes and Challenges: The Transformation of the U.S. Steel Industry," Center For the Study of American Business, Policy Study, Number 115 (March 1993).
Ehrbar, Al. "Price of Progress: 'Re-Engineering' Gives Firms New Efficiency, Workers the Pink Slip," Wall Street Journal (March 16, 1993).
Hopkins, Thomas D. Cost of Regulation (Rochester Institute of Technology, 1991).
Lowenstein, Ronnie and Richard Peach. "The Impact of the Current Defense Build-down," Federal Reserve Bank of New York Quarterly Review (Autumn 1992), pp. 59-68.
Ott, Mack. "The Growing Share of Services in the U.S. Economy—Degeneration or Evolution?" Review, Federal Reserve Bank of St. Louis (June/July 1987), pp. 5-22.
Saunders, Norman C. "Employment Effects of the Rise and Fall in Defense Spending," Monthly Labor Review (April 1993), pp. 3-10.
Womack, James P., Daniel T. Jones and Daniel Roos. The Machine That Changed The World: The Story of Lean Production, (Harper Perennial, 1991).
Zachary, G. Pascal and Bob Ortega. "Age of Angst: Workplace Revolution Boosts Productivity At Cost of Job Security," Wall Street Journal (March 10, 1993).

Views expressed in Regional Economist are not necessarily those of the St. Louis Fed or Federal Reserve System.
For the latest insights from our economists and other St. Louis Fed experts, visit On the Economy and subscribe.
Email Us